
Figure 4.
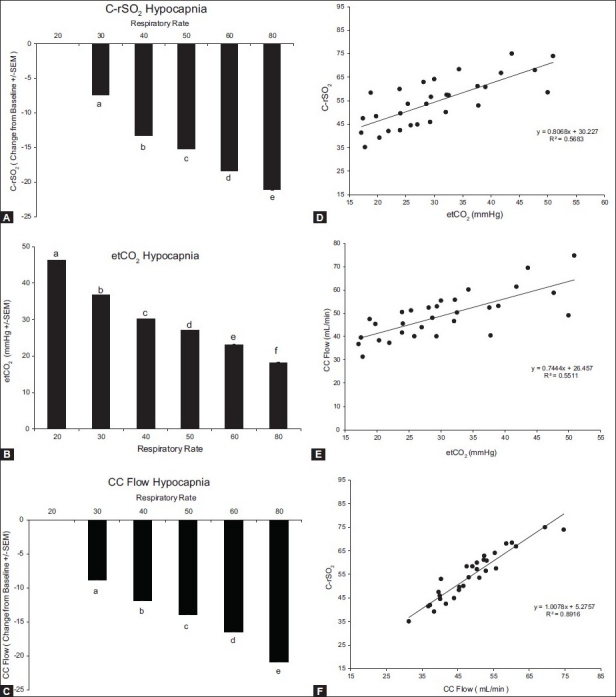
Response to hypocapnia. Change from baseline values for C-rSO2 (A), etCO2 (B), and CC flow (C). Bars represent the average of six animals and each letter represents a significant difference between the bars. Panels D-F depict the correlation between C-rSO2 and etCO2, CC flow and etCO2, and C-rSO2 and CC flow, respectively. All parameters correlate significantly