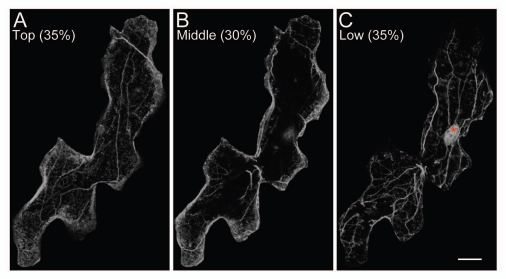
Figure 1.
Actin organization in leaf epidermal cells of A. thaliana. (A–C) Confocal micrographs of actin organization. Leaves were dark-adapted for 16 h. Actin (gray) was visualized by immunofluorescence microscopy. Epidermal cells were scanned from the upper to lower surfaces at 0.25-µm optical intervals, and the maximum projection was divided into three parts along the z-axis: the top 35% (A), middle 30% (B), and bottom 35% (C). Note that we manipulated images by blackening neighboring cells using image-processing software (Adobe Photoshop) to highlight the representative cell. An asterisk in (C) shows the nucleus. Bar = 20 µm.

