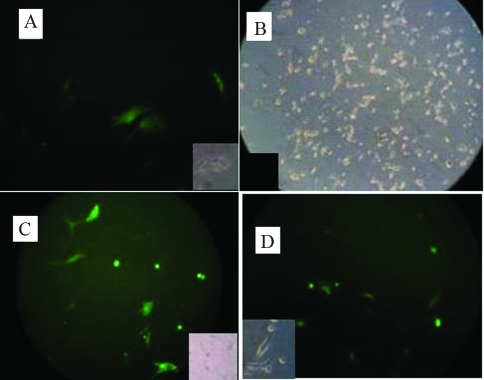
Figure 3-.
A, Fluorescence image of oviduct cells transfected with the pL-2.8OVtPAGFP vector. B, Bright field image of 3T3 cells transfected with the pL-2.8OVtPAGFP vector. C and D, Fluorescence images of oviduct epithelial cells and 3T3 cells, respectively, transfected with the pEGFP-N1 vector. The small images are bright-field/black photographs for A, B, C and D.

