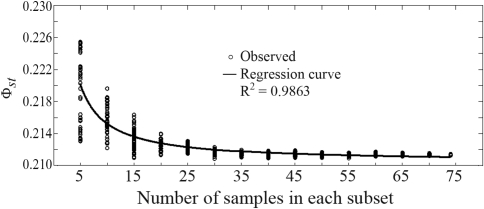
Figure 3.
The influence of sample size on estimated Φst among cultivars. Dots show the calculated genetic differentiation index (Φst) of each subset. Samples in various subsets were drawn 50 times from a total of 75 individuals. The regression formula applied was ln(Y) = b0 + (b1/t), where b0 and b1 are regression parameters, t the sample size and Y the genetic differentiation index (Φ st) of each subset.

