Figure 1.
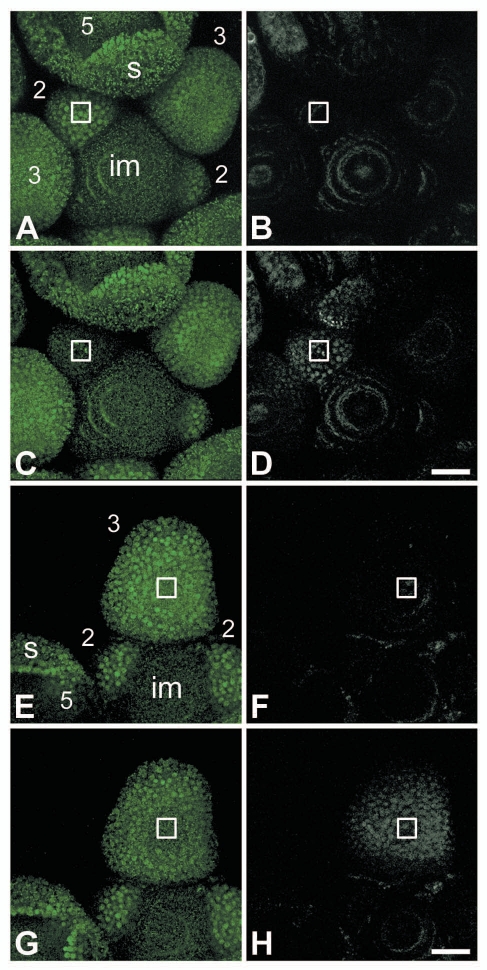
Photoconversion of AP1:mEosFP with 405 nm laser light. Confocal microscopy of mEosFP-tagged MAD S domain transcription factor APETA LA1 (AP1:mEosFP) in a wild-type Arabidopsis thaliana inflorescence before and after photoconversion of the mEosFP tag with 405 nm laser light at 100% power (A–D) and 25% power (E–H). The nuclei filled with unchanged, green AP1:mEosFP are visible as bright green dots, while the green autofluorescence is visible as small green speckles. Nuclei filled with the photoconverted red version of AP1:mEosFP are visible as bright white dots, while the preconversion scans show the presence of red autofluorescence in white. AP1:mEosFP is not present in the inflorescence meristem (im) and starts to appear from floral bud stage 1 onwards. In a stage 5 floral bud especially the tips of the sepals (s) show high levels of AP1:mEosFP. (A–D) Photoconversion was performed in a target area (indicated by the square) in a stage 2 floral bud by scanning one z-section 30 times with 405 nm laser light at 100% power. Localisations of green AP1:mEosFP before (A) and after photoconversion (C); showing overall reduced green fluorescence in the targeted floral bud after photoconversion. Localizations of red AP1:mEosFP before (B) and after photoconversion (D); demonstrating that not only the targeted floral bud was photoconverted, but also the adjacent floral buds. (E–H) Photoconversion was performed in a target area (indicated) in a stage 3 floral bud by scanning one z-section 30 times with 405 nm laser light at 25% power. Localizations of green AP1:mEosFP before (E) and after photoconversion (G); showing reduced green fluorescence in the middle of the targeted floral bud. Localizations of red AP1:mEosFP before (F) and after photoconversion (H); demonstrating that almost the whole targeted floral bud contains photoconverted AP1:mEosFP. Scale bars are 25 µm.

