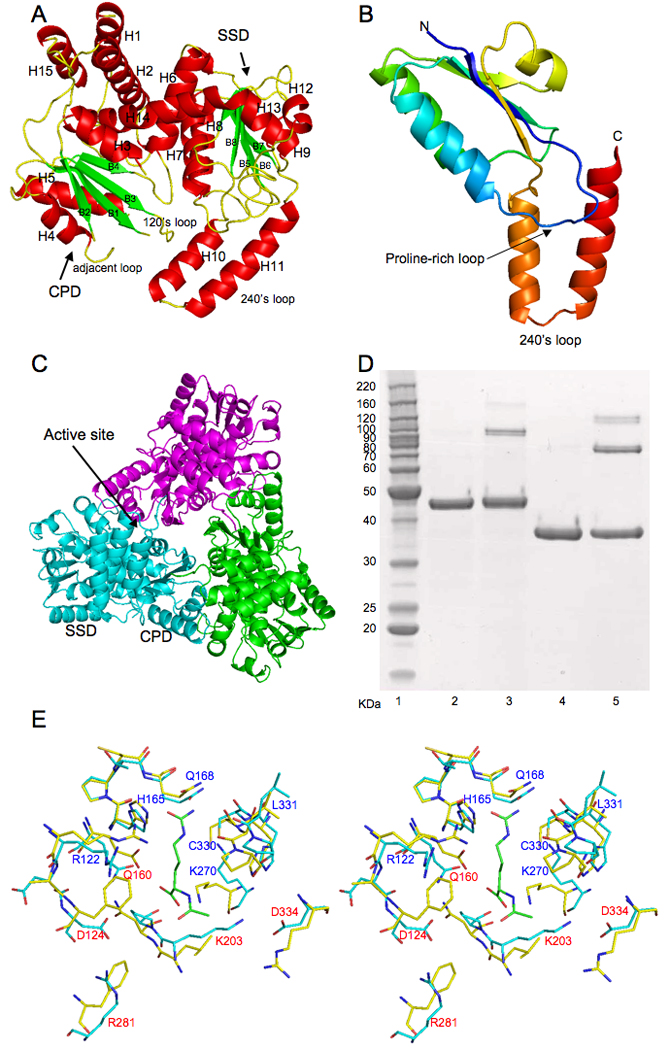
Figure 1.

A, Ribbon diagram of UTCase subunit. Green arrows indicate the direction of strands in β-sheet, α helices are in red. B, Ribbon diagram of the knotted region of E. coli UTCase (residues 208–326). Color changes continuously from blue (first residue in the region) to red (last residue in the region). The proline-rich loop (from dark blue to light blue) seems to be critical for the knot formation. The 240’s loop (from brown to red) was threaded through the proline-rich loop to form a 31 trefoil knot. C, Ribbon diagram of a trimer. Subunits are colored pink, green, and light blue. D, Cross-linking of E. coli UTCase. Lane 1: Molecular marker; Lane 2: E. coli UTCase without cross-linking agent; Lane 3: E. coli UTCase with cross-linking agent; Lane 4: E. coli OTCase without cross-linking agent as control; Lane 5: E. coli OTCase with cross-linking agent as control. E, Stereo view of the proposed substrate binding site of UTCase (shown in light blue sticks) in comparison to AOTCase (shown in light yellow sticks, PDB accession number 3KZK). Bound N-acetyl-L-citrulline for AOTCase is shown in green sticks. Conserved residues are labeled as blue. Different residues are label as red.
