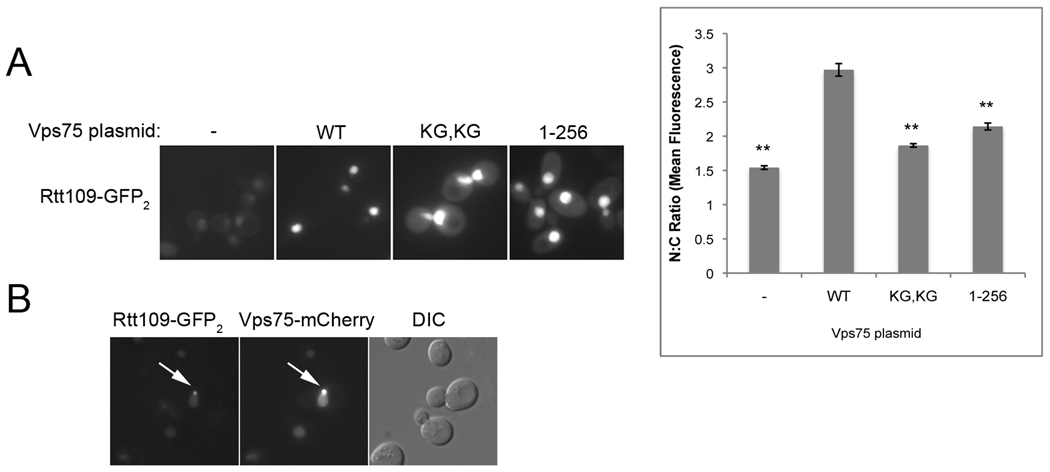
FIG 3.
Vps75 promotes nuclear localization of Rtt109. (A) Rtt109-GFP2 was expressed in rtt109Δvps75Δ containing either pRS316 (−) or plasmids expressing the indicated mutants of Vps75 and observed by fluorescent imaging. KG, KG represents Vps75(K260G, K261G). The mean fluorescence intensity of a defined pixel area was measured in the nucleus (N) and the cytoplasm (C) and used to calculate the N:C ratio. The mean ratio for more than 190 cells was calculated for each strain and graphed along with standard error. ** p≪ 0.0001 compared to wild type (WT). (B) Rtt109-GFP2 was expressed in VPS75-mCherry yeast and both were observed by fluorescent imaging. DIC image is also shown. Arrows indicate colocalizing fluorescent proteins in one of these foci.

