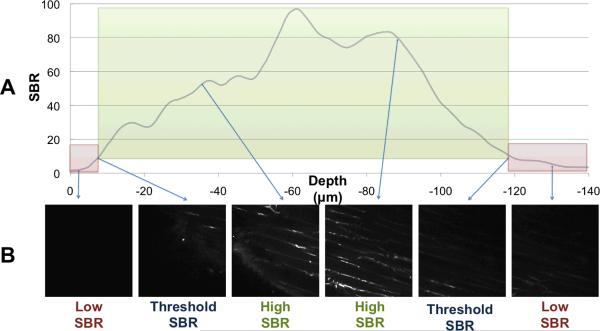
Figure 2.
ROVAR uses image SBR to calculate starting and ending depth of each Z stack At each location in X-Y that is part of the imaging volume, the SBR is calculated at each depth. A threshold of SBR is set at which to locate the surface and the maximum imaging depth (A). Thus the image stack that is saved is only of high-SBR images at or above the threshold SBR (B).

