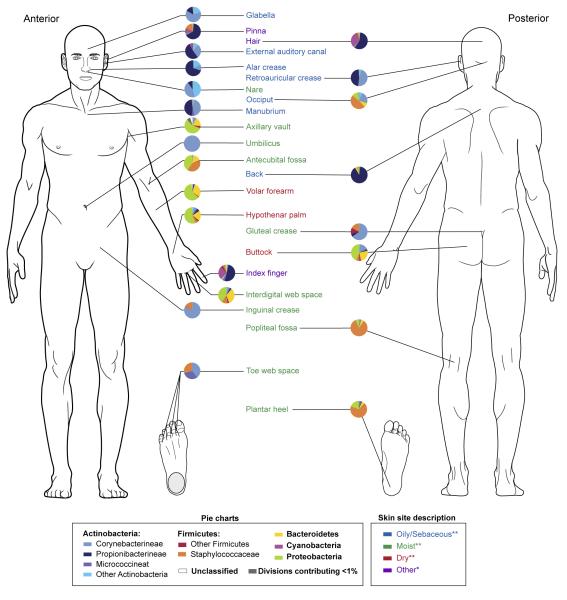
Figure 3.
Heterogeneity and pattern of distribution of the skin microbiome for over 20 skin sites. Each pie chart represents the relative abundance of different bacterial phyla at the indicated sites. Bacterial diversity varies among the many skin sites. Sites sharing physiologic features such as oily skin have greater similarities in the bacterial composition. Data derived primarily from [43]** with additional data from [41]*.

