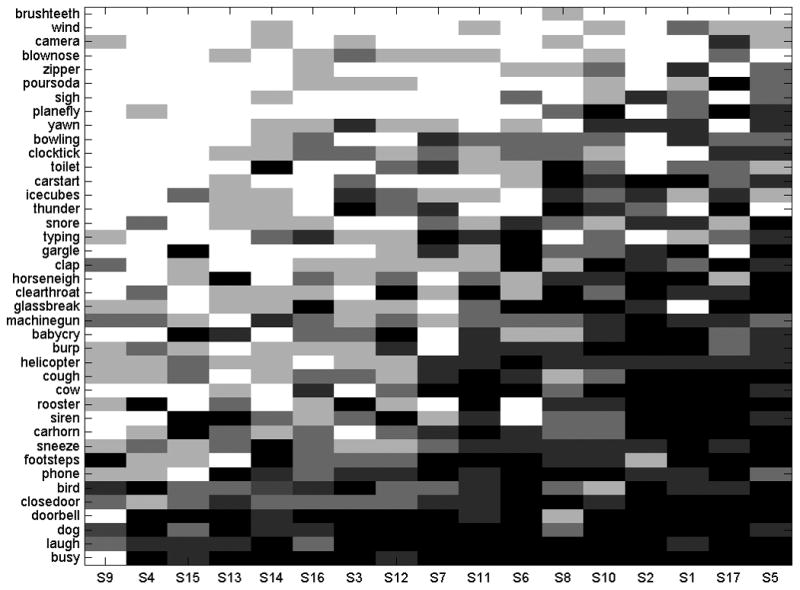
Figure 3.

Individual sound source identification accuracy for each study participant. Sound source names are listed on the ordinate and individual participants are on the abscissa. The accuracy is represented by darkness of each cell (the darker the more accurate). The sounds are arranged vertically based on their overall accuracy – those at the bottom were the easiest and those at the top were the most difficult to identify. The participants are arranged based on overall performance accuracy from left to right, starting with the least accurate participant on the left.
