
Figure 1.
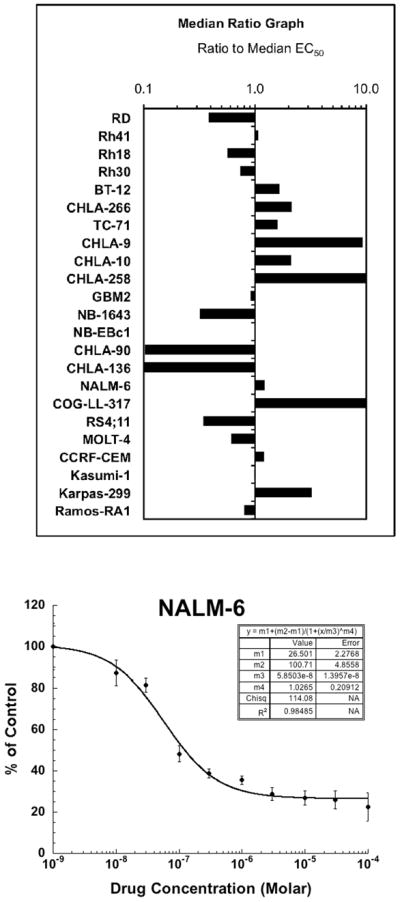
PG11047 in vitro activity. Top panel: The median relative IC50 (EC50) ratio graph shows the relationship between the relative IC50 values for the cell lines of the PPTP in vitro panel. Each bar represents the ratio of the median relative IC50 for the entire cell line panel to the relative IC50 value of the indicated cell line. Bars to the right represent cell lines with higher sensitivity, while bars to the left indicate cell lines with lesser sensitivity. Bottom panel: Representative dose response curve for the NALM-6 (ALL) cell line.