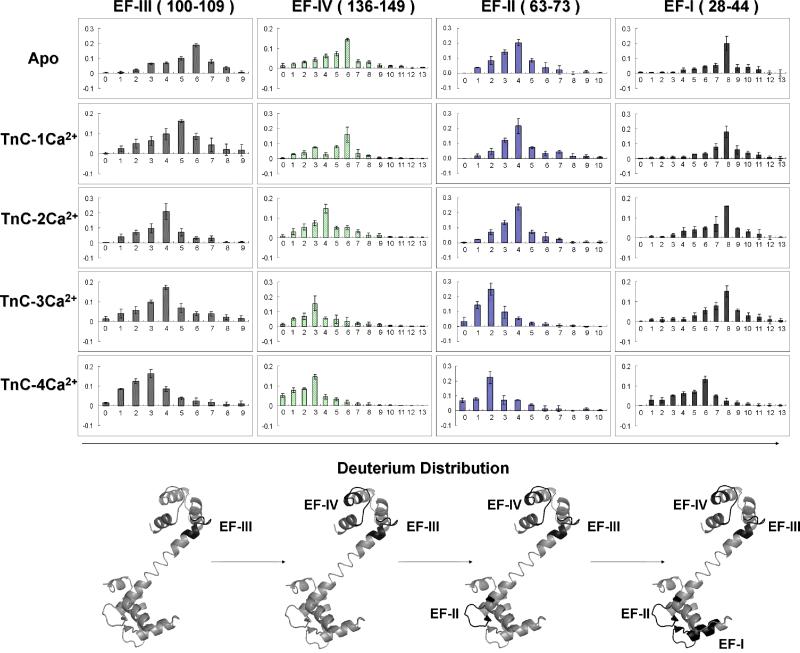
Figure 5.
Top: Each column represents the deuterium distributions of the peptic peptide of EF hands: III, IV, II, I (left to right). Each row represents the various Ca2+ bound TnC states: Apo (Absent Ca2+) to 4 Ca2+ bound TnC (top to bottom). Bottom: X-ray crystal structure of rabbit skeletal troponin C (PDB: 1TCF) in gray, and the four EF hands are in black.

