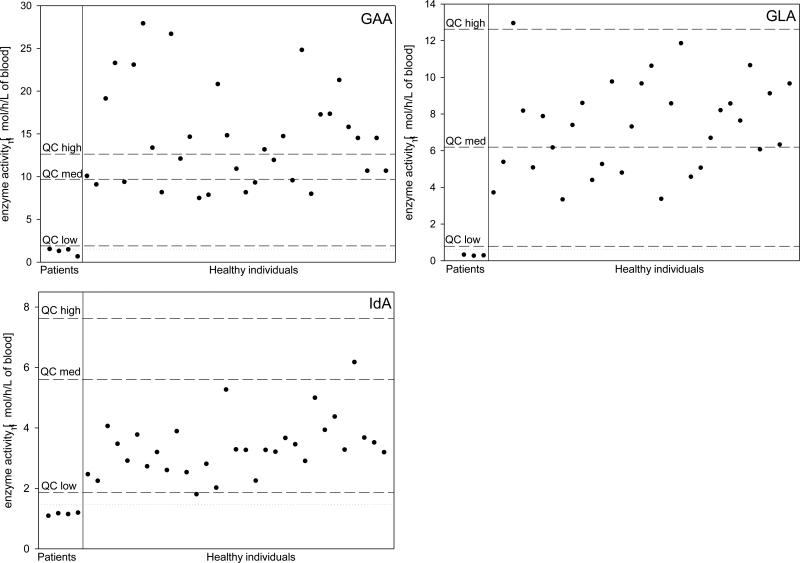
Figure 3.
Enzyme activity distribution determined by LC-ESI-MS/MS after acetonitrile mediated protein precipitation for individual sample measurements (the individual values are given in Table S8). The dotted lines correspond to QC base activity, and the dashed lines indicate QC low, QC medium, and QC high levels, respectively.

