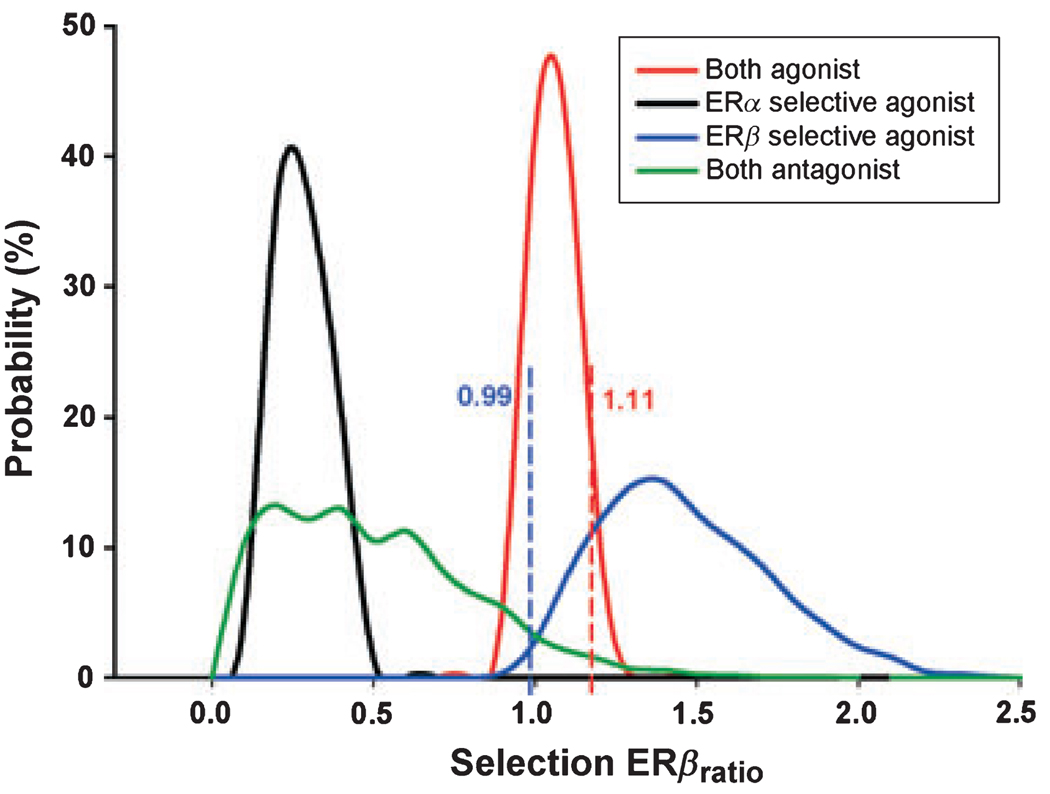
Figure 2.
Threshold Selection ERβratio value by Monte Carlo simulation. A total of 10 000 random Eave values for each group were used in Selection ERβratio calculation as described in text. ERβ selective agonist group is quite distinguishable from ERα selective agonist and both antagonist group but has some overlap with both agonist group. Red dash line shows the one side 95% confidence value of both agonist group. And blue dash line shows the lower limit of ERβ selective agonist group (95% confidence).

