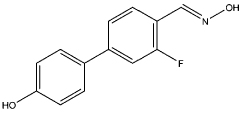
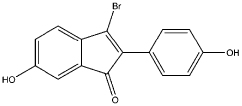
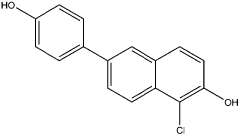
Table 1.
Validation set compounds used in single-structure model.
| Number | Structure | ERβ score/ERα score | Computational RBAratio | Experimental RBAratio | Reference |
|---|---|---|---|---|---|
| 1 |  |
0.90 | 0.51 | 11 | compound 6e, (41) |
| 2 |  |
0.85 | 0.50 | 13 | compound 34 (38) |
| 3 |  |
0.86 | 0.44 | 15 | compound 14 (38) |
| 4 |  |
0.87 | 0.49 | 29 | compound 90(37) |
| 5 |  |
0.92 | 0.69 | 36 | compound 15 (39) |
| 6 |  |
0.90 | 0.67 | >43 | compound 6o (41) |
| 7 |  |
0.99 | 1.01 | 72 | compound 61 (36) |
| 8 |  |
0.97 | 0.95 | 72 | compound 16a (40) |
| 9 |  |
0.99 | 1.0 | 81 | compound 93 (37) |
| 10 |  |
1.02 | 1.12 | 102 | compound 12e (35) |
| 11 |  |
1.05 | 1.14 | 108 | compound 22 (34) |
| 12 |  |
1.12 | 2.81 | 226 | compound 117 (37) |
RBA, relative binding affinity.
