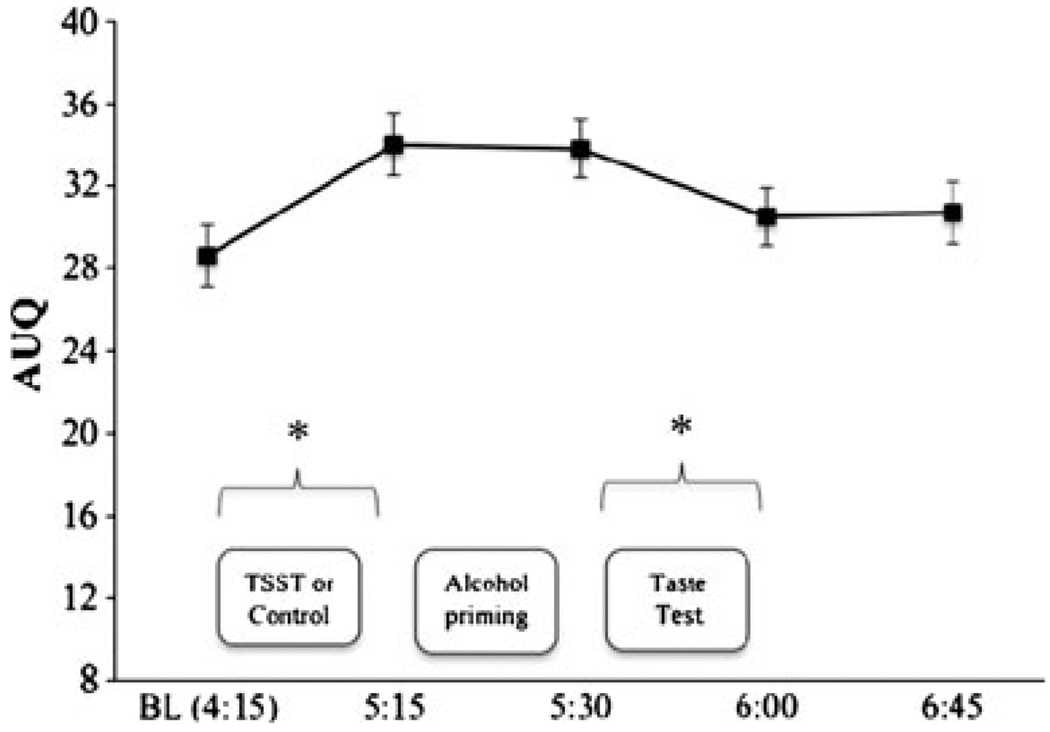
Fig. 3.
Mean (bars show SE) Alcohol Urge Questionnaire scores over the course of the challenge day collapsed across stressor groups. Asterisks reflect significant change over time (p<0.05). Craving increased from pre- to post-stress manipulation (but not differentially by stressor group). Alcohol craving decreased following the taste test (where participants were allowed to drink up to 24 oz of beer)

