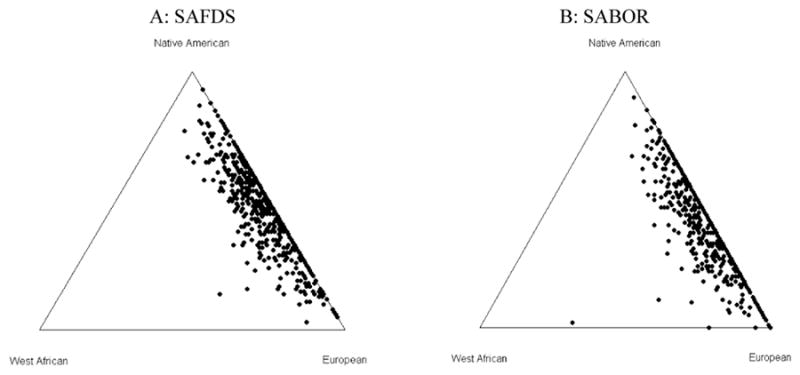
Figure 2.

Triangle plots with individual admixture estimates obtained using 64 AIMs for the SAFDS (A, left) and 62 AIMS for the SABOR (B, right) samples. Each side of the triangle represents a proportion of 0%, with the point of the triangle opposite that base representing a proportion of 100% for the respective ancestry
