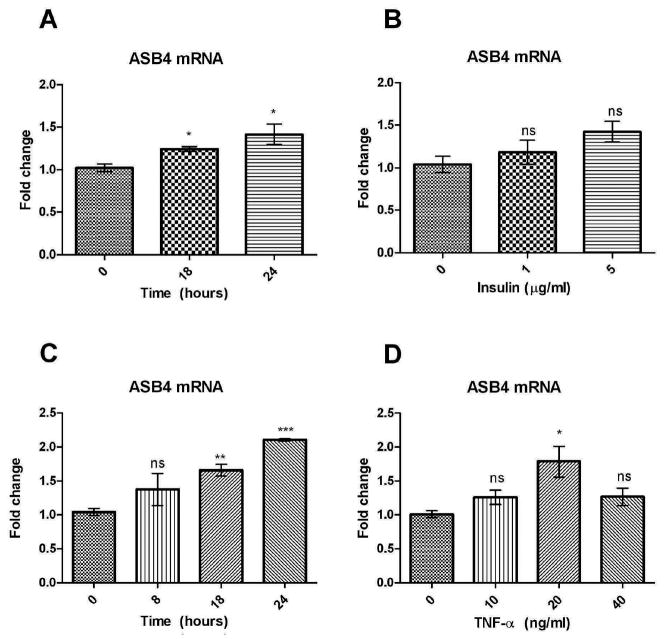
Figure 4.
ASB4 mRNA expression levels in MS1 cells following TNF-α or insulin treatment. Cells were serum starved for 16 hours before treatment. After treatment, real-time PCR analysis was performed. Data were normalized and significance calculated to expression at 0 hours. (A) MS1 cells were treated with 20 ng/ml TNF-α for 0, 8, 18 or 24 hours. (B) MS1 cells were treated with 0, 10, 20 or 40 ng/ml TNF-α for 24 hours. (C) MS1 cells were treated with 10 μg/ml insulin for 0, 18 or 24 hours. (D) MS1 cells (P. 13) were treated with 0, 1 or 5 μg/ml insulin for 18 hours. Results are shown as mean ± SD of three independent experiments. ***p < 0.0001, **p < 0.005, *p < 0.05, ns = non-significant.

