
Fig. 2.
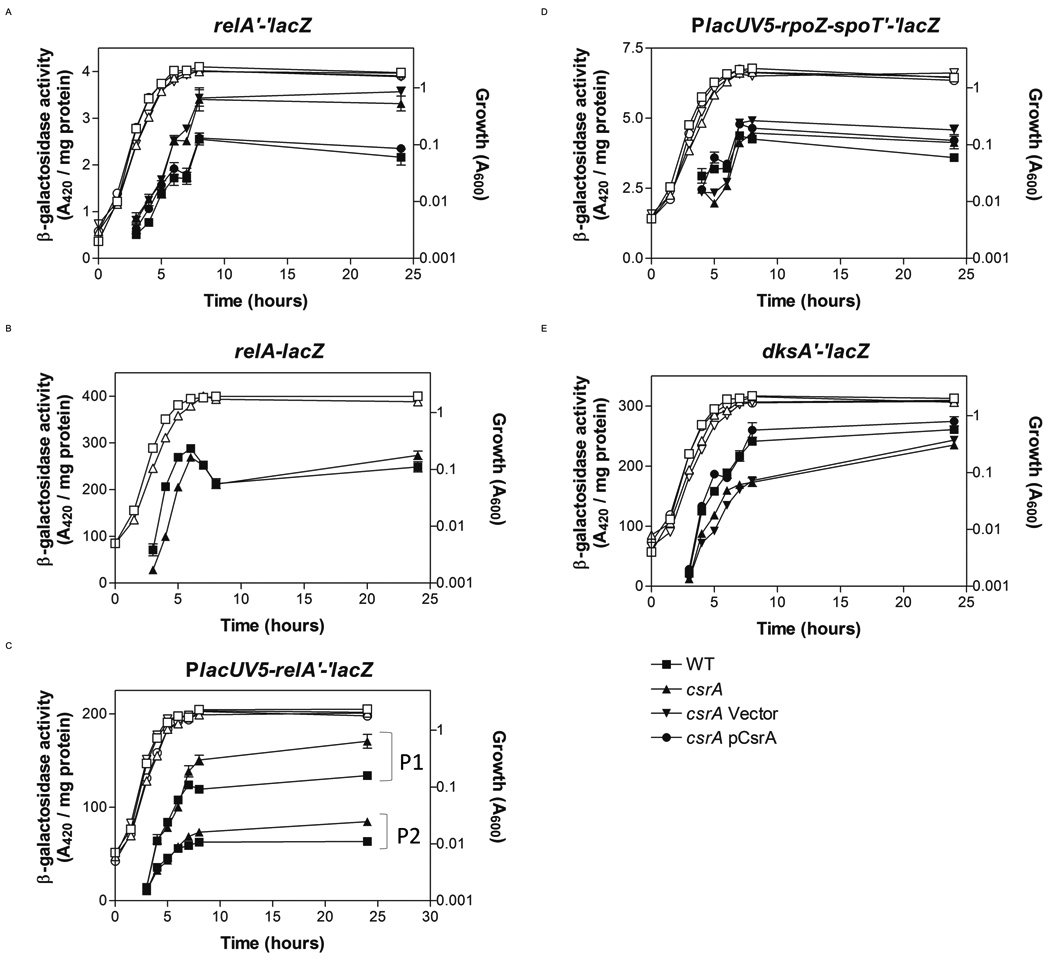
Effects of csrA on expression of relA, spoT and dksA reporter fusions. Cells were harvested at various times throughout growth and assayed for β-galactosidase specific activity (A420 / mg protein). The values represent the average of two independent experiments. Error bars depict standard error of the mean. (A–E) Activity of indicated fusions in wild-type, ■; csrA, ▲; csrA pGB2 (empty vector), ▼; and csrA pCsrA (csrA+), ●. (E) Strain identities were identical, except pBR322 (empty vector, ▼) and pCRA16 (csrA+, ●) were used for complementation. Growth curves are represented by corresponding open symbols.