
Fig. 3.
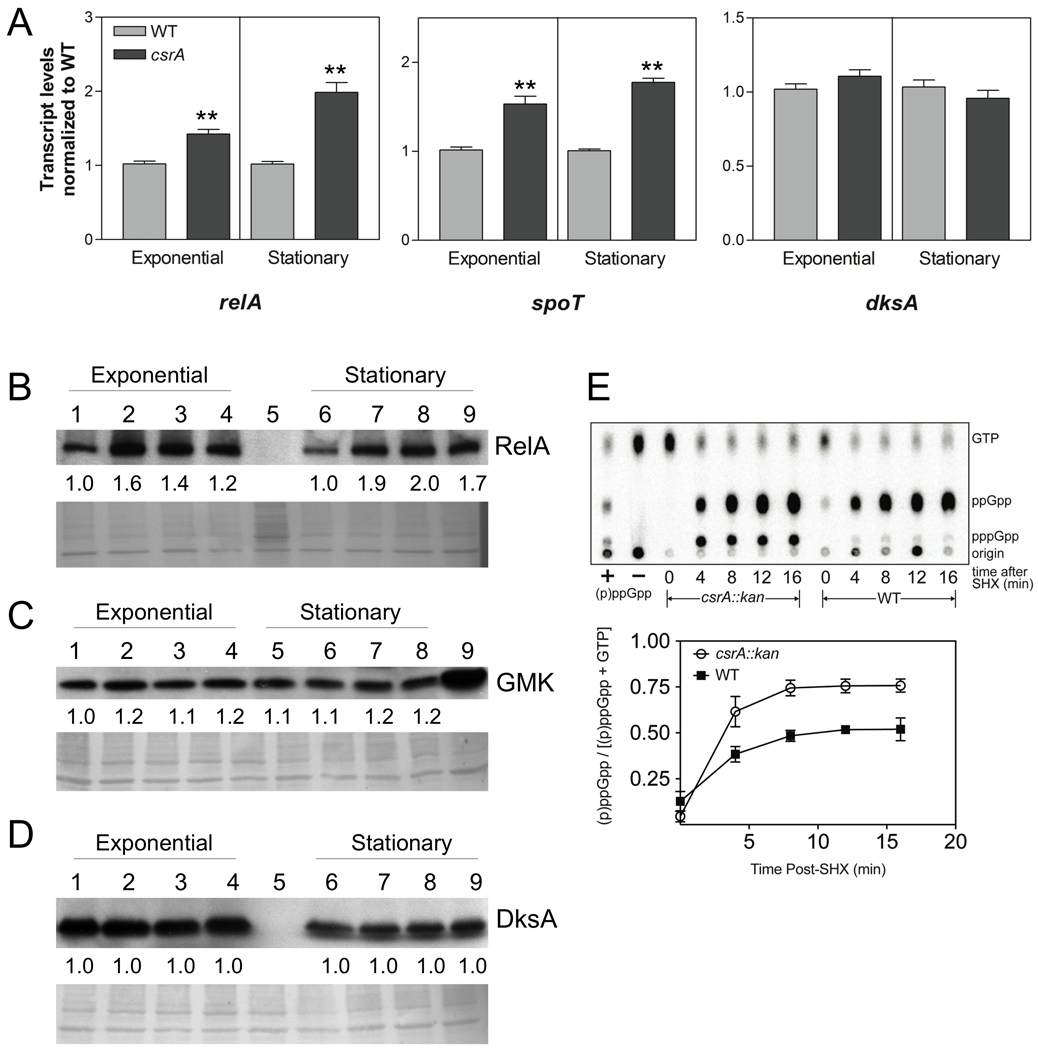
Effects of csrA on relA, spoT and dksA transcripts, gene products, and (p)ppGpp levels during stringent response. (A) Samples of MG1655 (WT) and TRMG1655 (csrA::kan) were taken for RNA isolation at exponential phase (OD600 = 0.5) and stationary phase (at 8 hours of growth), and RNA samples were analyzed by rt-qRT-PCR. The values represent the average of two independent experiments. Error bars depict standard error of the mean (** P < 0.001). (B–D) Effects of csrA disruption and complementation on RelA, GMK and DksA protein levels by Western blotting. Shown below each representative blot, the PVDF membrane was stained using the MemCode™ Reversible Protein Stain Kit (Pierce Biotechnology, Rockford, IL) and imaged as a loading control. Protein was harvested at exponential (OD600 = 0.5) and stationary phases (after 8 hours of growth). (B) RelA; Lane 1,6 MG1655; Lane 2,7 csrA::kan; Lane 3,8 csrA::kan pGB2; Lane 4,9 csrA::kan pCsrA; Lane 5, relA::kan spoT::cat. (C) GMK; Lane 1,5 MG1655; Lane 2,6 csrA::kan; Lane 3,7 csrA::kan pGB2; Lane 4,8 csrA::kan pCsrA; and Lane 9, CF80005 (pGMK). (D) DksA; Lane 1,6 MG1655; Lane 2,7 csrA::kan; Lane 3,8 csrA::kan pGB2; Lane 4,9 csrA::kan pCsrA; Lane 5, dksA::kan. Fold differences in protein levels (relative to wild-type) represent the average of three independent experiments. The standard deviation for all values was less than 10% from the mean. (E) Determination of CsrA effects on (p)ppGpp accumulation during stringent response. MG1655 (wild-type) and csrA::kan strains were grown to mid-logarithmic phase, treated with serine hydroxamate (SHX) (200 µg ml−1) to induce the stringent response, and nucleotides were labeled and analyzed by thin-layer chromatography (TLC) as described in Experimental Procedures. The upper panel depicts phosphorimaging of the TLC plate, the lower panel depicts the ratio of (p)ppGpp to guanine nucleotides [(p)ppGpp and GTP)] for the wild-type and csrA mutant strains. These values represent the averages of three independent experiments. Error bars depict the standard errors of the means.