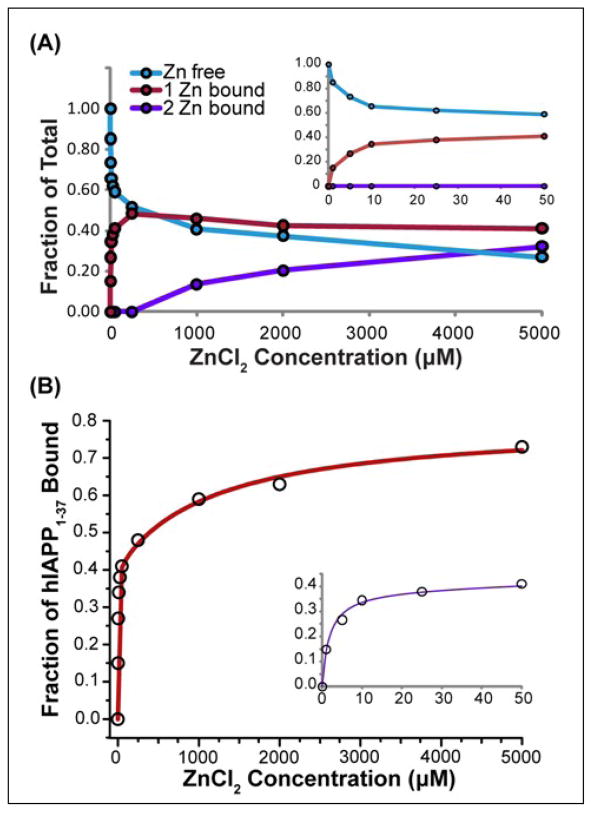
Figure 7.
(A) Concentration dependence of zinc binding of 10 μM hIAPP1–37 by ESI-MS. The first binding site is saturated at 10 μM ZnCl2, while a second binding site becomes evident at 1000 μM ZnCl2. (B) Comparison of experimental values to a fit of the data according to a two site independent binding model. A close-up of the low zinc concentration values is shown in the inset. Kd values from the fit were calculated to be 2 ± 0.3 μM and 1200 ± 300 μM.

