
Figure 20.
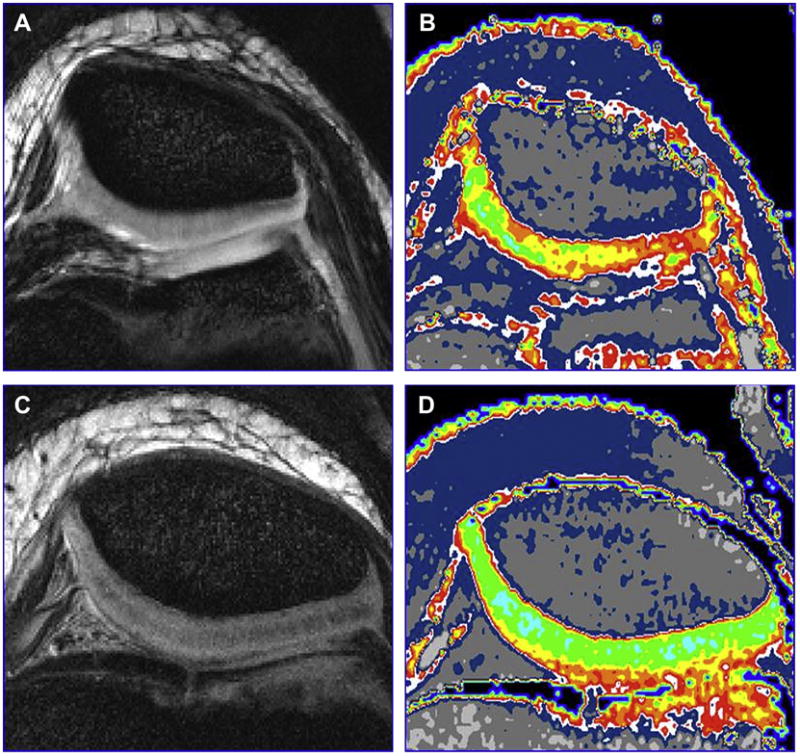
Figure 20A, B, C, D. Here is an example of the use of T2 mapping to show matrix changes. The morphologic images of 10-year old girl with Juvenile Rheumatoid Arthritis (A) and a healthy 10-year old boy (C) and are both normal. The T2 maps (B, D) show large areas of collagen matrix disruption in the patient with JRA (B) (Courtesy of Bernard Dardzinski, Merck).