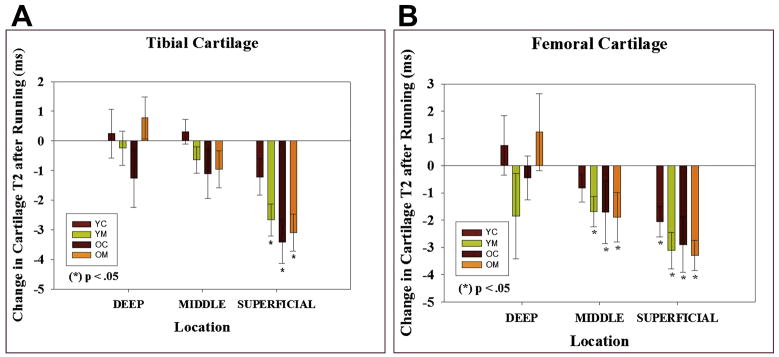
Figure 23.
Figure 23A, B. Functional Cartilage T2 mapping: Evaluating local tissue response to running.
YC: Young (18 – 30) control, YM young marathoner, OC: old (45 – 55 years) sedentary control, OM: old marathoner: Change in cartilage T2 values after 30 minutes of running demonstrate statistically significant decrease in T2 values of superficial femoral and tibial cartilage, but no change in T2 near the bone cartilage interface (reproduced with permission from Mosher TJ et al. Osteoarthritis Cartilage;18(3):358–364).

