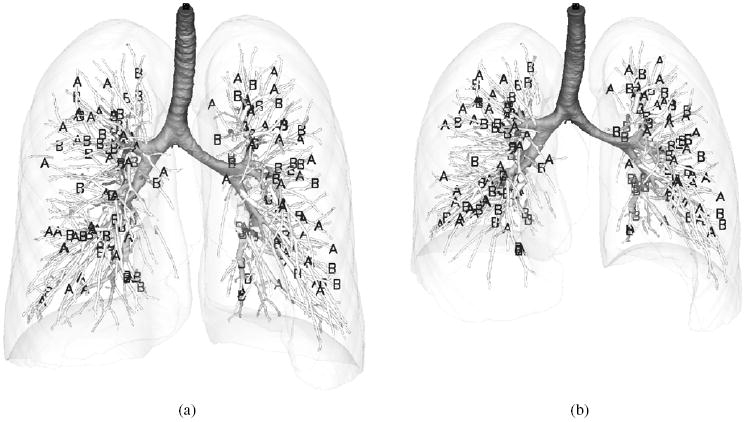
Figure 4.

Illustration of landmark locations for (a) TLC and (b) FRC from one subject. The landmarks used for matching are marked by ‘A’ and the landmarks used for validation are marked by ‘B’. Surface rendering of airways, major vessels and lungs is shown for reference.
