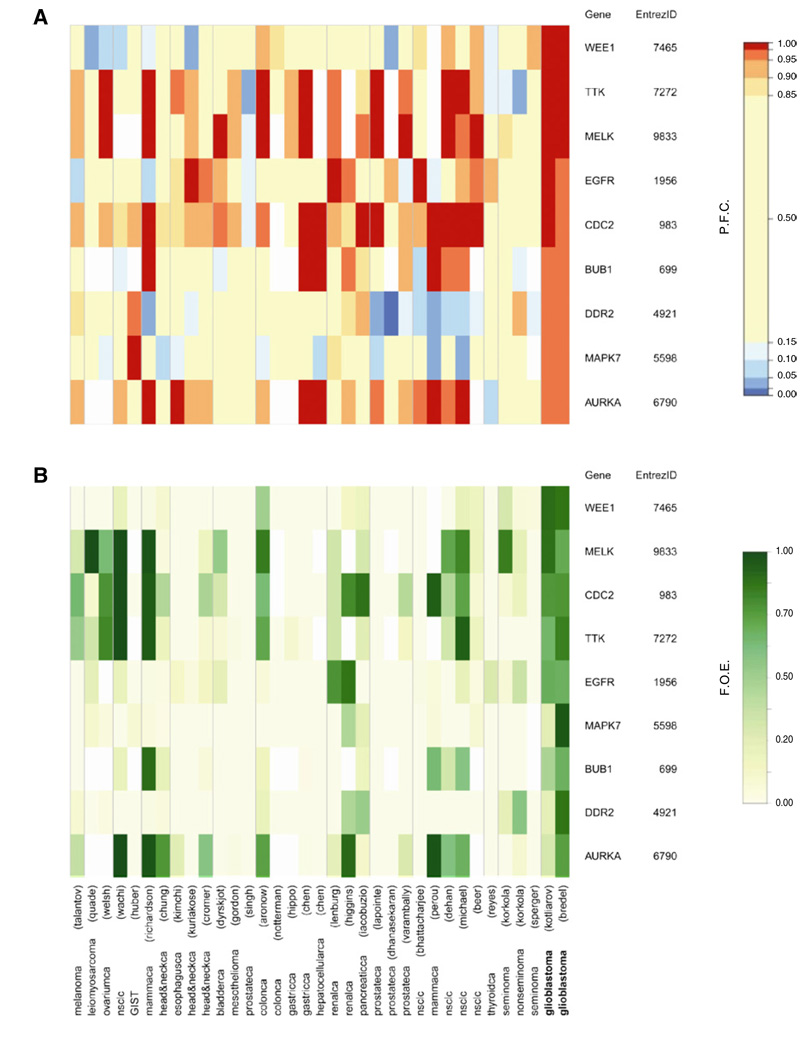
Figure 2. Glioblastoma-Specific Kinases.
Heatmaps of percentile fold change gene expression (A) and frequency of overexpression (B) of nine glioblastoma-specific kinases (rows) in data sets (columns). F.O.E., frequency of overexpression; P.F.C., percentile fold change. See also Table S3 and Table S4.

