
FIG. 3.
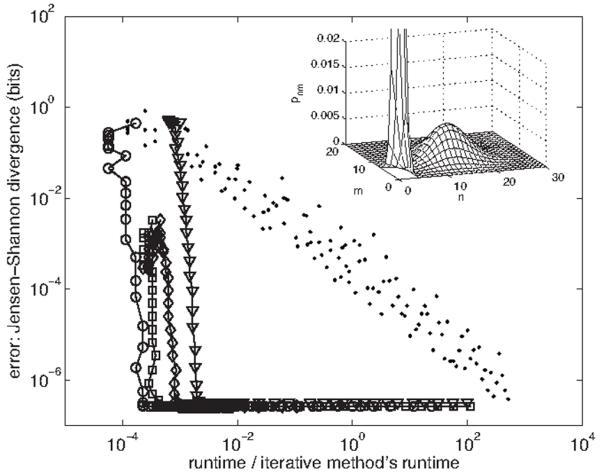
Error vs runtime for the spectral method and stochastic simulation. Error is the Jensen-Shannon divergence [41] between pnm obtained using the |n,m〉 basis (via iterative solution of the original master equation) and that obtained using the |j,k〉 basis [circles; cf. Eq. (80)], the |j,kj〉 basis [triangles; cf. Eq. (90)], the |n,kn〉 basis [squares; cf. Eq. (100)], the |j,kn〉 basis [diamonds; cf. Eq. (114)], or stochastic simulation [28] (dots). Runtimes are scaled by that of the iterative solution, 150 s (in matlab). Spectral basis data is obtained by varying K, the cutoff in the eigenmode number k of the second gene; simulation data is obtained by varying the integration time. The input distribution [from which gn is calculated via Eq. (59)] is a mixture of two Poisson distributions with λ1=0.5, λ2=15, and π1=0.5. The regulation function is a Hill function with q−=1, q+=11, n0=7, and ν=2. The gauge choices used (cf. Fig. 2) are g‾=Σn pngn, q‾=Σn pnqn, q‾n=qn, and q‾j=Σn〈j|n〉qn〈n|j〉. The cutoffs used are J=80 for the eigenmode number j of the first gene and N=50 for the protein numbers n and m. Inset: the joint probability distribution pnm. The peak at low protein number extends to p00≈0.1.