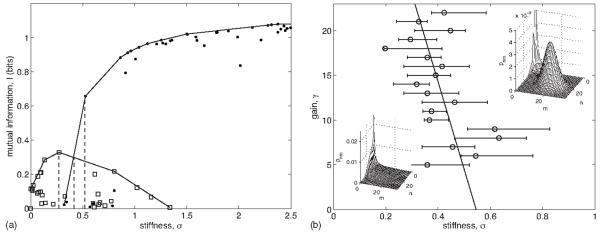
FIG. 5.
(A) Mutual information I [cf. Eq. (158)] versus stiffness σ [cf. Eq. (160)] for fixed gain [γ=16, cf. Eq. (159)] obtained by optimizing Eq. (161) for λ values between 10−3 and 101. Squares denote solutions whose joint distribution pnm has one peak (cf. B, lower left inset), and dots denote solutions for which pnm has two peaks (cf. B, upper right inset). Solid lines show the convex hulls of the one- and two-peaked solutions. Dotted lines indicate the stiffness value at which the hulls intersect and the stiffness values of the hull points to the left and right of the intersection. (B) Phase diagram between one- and two-peaked optimal solutions in the gain-stiffness plane. Circles and left and right error bars at each gain are determined by the stiffness values at the intersection of the one- and two-peak convex hulls and at the hull points to the left and right of the intersection, respectively (see dotted lines for the example case in A). Solid line shows a line of best fit. Insets show examples of one-(lower left) and two-peaked (upper right) optimal distributions pnm.

