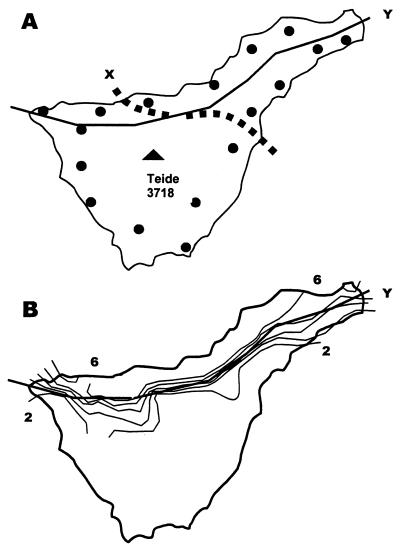
Figure 1.
(A) Map of Tenerife showing study localities and approximate distribution of eastern and western lineages (X; although opposing haplotypes interdigitate either side of this line), and northern and southern biotopes (Y) with populations that have different reflective lateral markings. (B) Geographic variation in the reflective shoulder markings is a stepped cline coinciding with the ecotone (Y) where the contours 2–6 (on a 0–10 range) represent an increase in size with a decrease in mean value (derived from 18).

