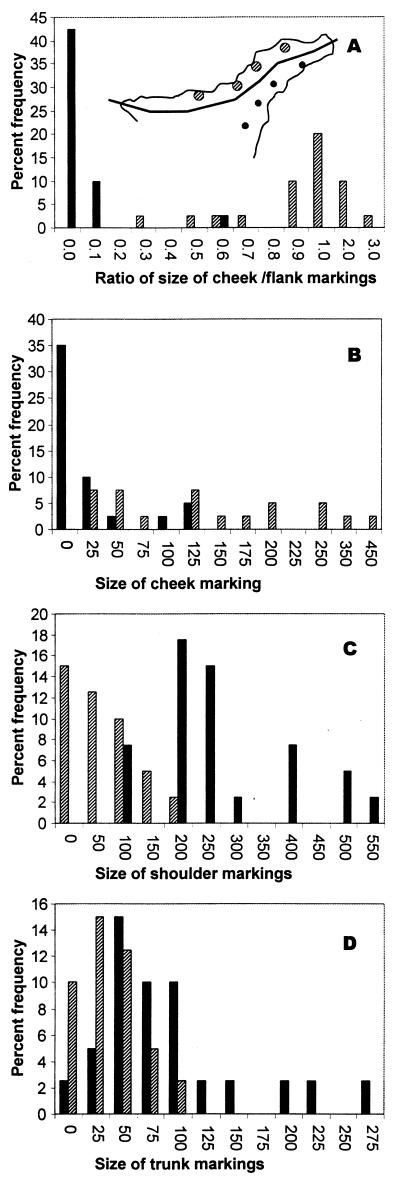
Figure 4.
Histograms showing the bimodality of UV reflective markings based on four pairs of populations either side of the ecotone (Inset) in largely the range of the eastern lineage (southern, solid bars; northern, hatched bars). (A) The ratio of the size of the cheek marking to flank (shoulder + trunk) marking shows distinct widely separated modes with almost no overlap. The cheek (B), shoulder (C), and trunk (D) frequency against size in number of scales covered.

