Fig. 1.
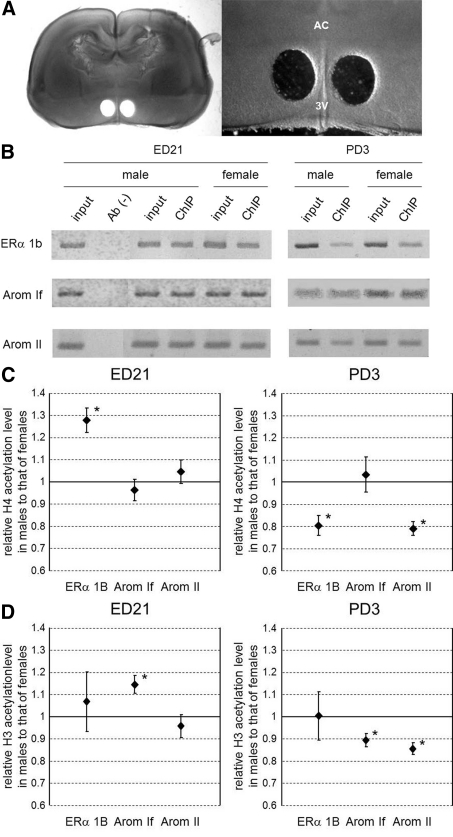
Histone acetylation level of ERα and Arom gene promoters in the MPOA during the perinatal period. A, Isolation of the MPOA in perinatal rats, with representative image of a section of PD3 rat brain including the POA after isolation of the MPOA (left) and higher magnification of the image including the MPOA (right). AC, Anterior commissure; 3V, third ventricle. B, Immunoprecipitated chromatin containing acetylated H4. The amounts of ERα 1b (top), Arom If (middle), and Arom II (bottom) promoter DNA in the precipitate were examined by PCR. Images of ethidium bromide-stained gels were captured in grayscale and inverted. ChIP was conducted with samples from ED21 (left) and PD3 (right) brains. Ab(−), No-antibody control for confirmation of specific immunoprecipitation; input, input chromatin control to quantify the amount of DNA present in samples before immunoprecipitation; ChIP, ChIP sample. C, Pixel intensities of grayscale images were measured, and ChIP/input ratios were compared between the sexes. The graphs show the relative ChIP/input ratios of males compared with females (mean ± sem). Data from ED21 (left) and PD3 (right) brains. *, P < 0.05 for male vs. female. D, Immunoprecipitated chromatin containing acetylated H3. The graphs show the relative acetylated H3 level of males compared with females (mean ± sem). Data from ED21 (left) and PD3 (right) brains. *, P < 0.05 for male vs. female.

