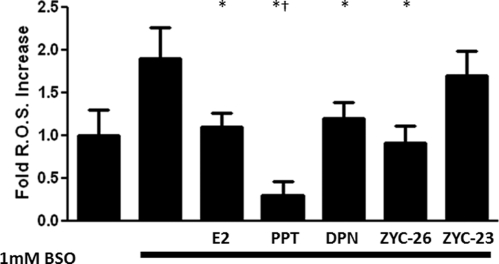
Fig. 7.
Effects of E2, PPT, DPN, ZYC-26, and ZYC-23 on the formation of ROS in BSO-treated FRDA fibroblasts. All steroid concentrations were 100 nm. Depicted are mean ± sd (n = 8 per group). *, P < 0.05 vs. BSO alone-treated cells, †, P < 0.05 vs. BSO + E2/DPN/ZYC-26-treated cell groups and P < 0.05 vs. DMSO vehicle control-treated cells.

