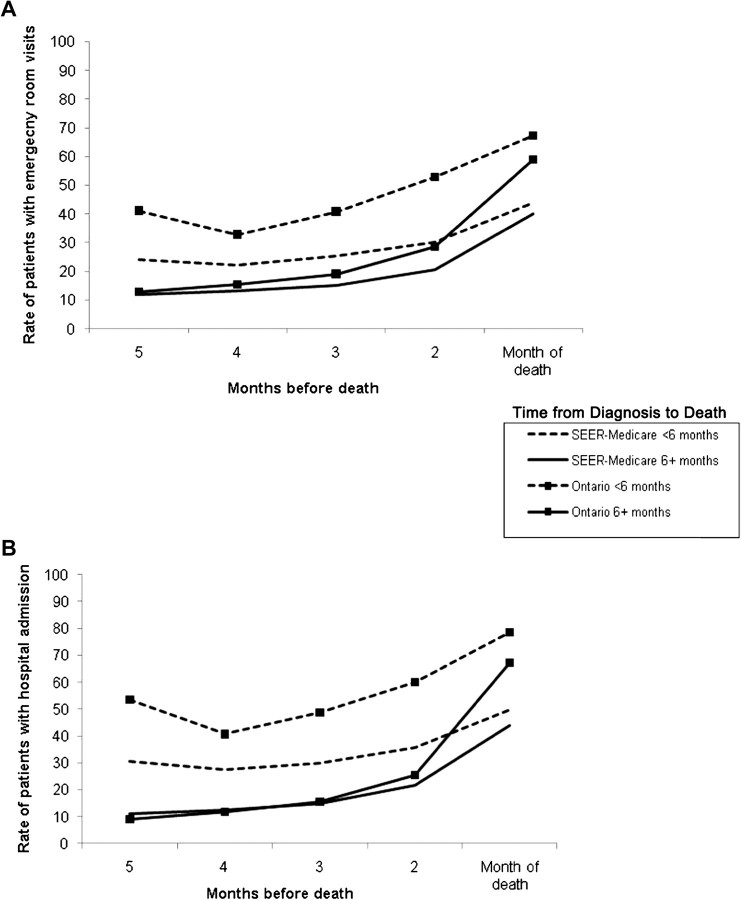
Figure 2.
Adjusted rates of emergency room (ER) and hospital use in the last 5 months of life for non–small cell lung cancer patients who died of cancer at age 65 years and older, 1999–2003. A) Rates of ER admissions (No. of patients admitted per 100 person-months [PM]). B) Rates of inpatient hospital admissions (No. of patients admitted per 100 PM). Monthly rates were adjusted for age (65–69, 70–79, and ≥80 years), sex, income (two highest quintiles, other), and urbanicity (big metropolitan, metropolitan, other). Standardized monthly rates were compared using 99% confidence intervals. For ER visits, P values for differences in all rates for SEER–Medicare patients vs Ontario patients surviving less than 6 months were less than .001. For patients surviving 6 or more months, P values were .152 at 5 months before death, .003 for 4 months before death, and less than.001 for 3–1 month(s) before death. For hospital admissions, P values for differences in all rates for SEER–Medicare patients vs Ontario patients surviving less than 6 months were less than .001. For patients surviving 6 or more months, P values were .222 at 4 months before death, .366 for 3 months before death, and less than.001 for months 5, 2, and 1 before death. The P values for the monthly rates were calculated by creating confidence intervals for the difference between the two standardized rates. The P value reported is such that the (1−P) % confidence interval just includes zero. All statistical tests were two-sided. SEER = Surveillance, Epidemiology, and End Results database.

