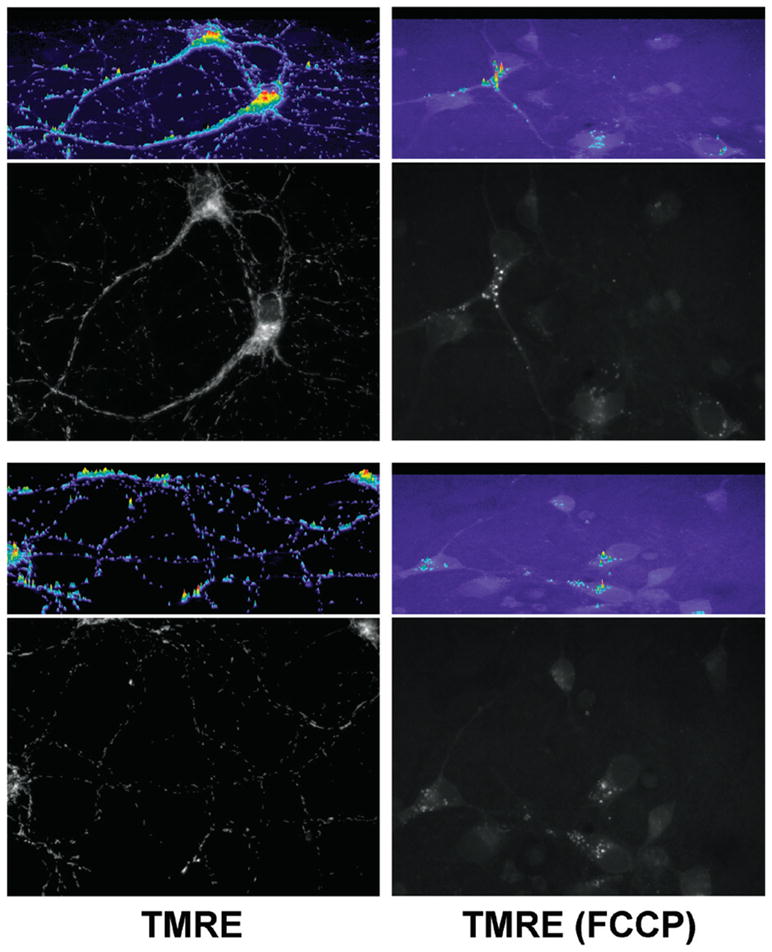
Figure 1. TMRE loads specifically into polarized mitochondria.

11–14-day-old primary mouse cortical neurons were loaded for 20 min at 37°C with 1 nM TMRE in Hanks Balanced Salt Solution (HBSS), either without (TMRE) or with [TMRE (FCCP)] 10 μM FCCP in the loading bath. After the 20-min loading, cells remained in the same loading bath, and images at 60× were taken for each condition (100-ms exposure times) using a Chroma HQ535/50x:Q565LP:HQ610/75m filter and dichroic set (Bellows Falls, VT, USA). Two images/condition are presented here. Images are the raw 12-bit grayscale images, converted to 8-bit grayscale for presentation using ImageJ. Immediately above each image, a relative intensity profile in color is presented for the whole image area (Metamorph). Note the specific mitochondrial TMRE loading—in neuronal soma and neurites but excluded from the nucleus as expected—that occurs only when mitochondria are polarized. Also note that contrary to conventional “cartoon” imagery of oval-shaped mitochondria, the elongated, fibrillar mitochondrial shape seen here is typical of many cell types (e.g., References 37 and 38). As demonstrated by the grayscale images and corresponding color intensity profiles, in the depolarized (FCCP) condition, mitochondrial TMRE labeling is completely absent reflecting a complete depolarization of Δψm, with only trivial signal arising from a small amount of cytoplasmic vesicular labeling that appears only in the FCCP condition. Note also the considerably higher background fluorescence in the FCCP condition, due to the TMRE remaining in the bath rather than being concentrated by mitochondria.
