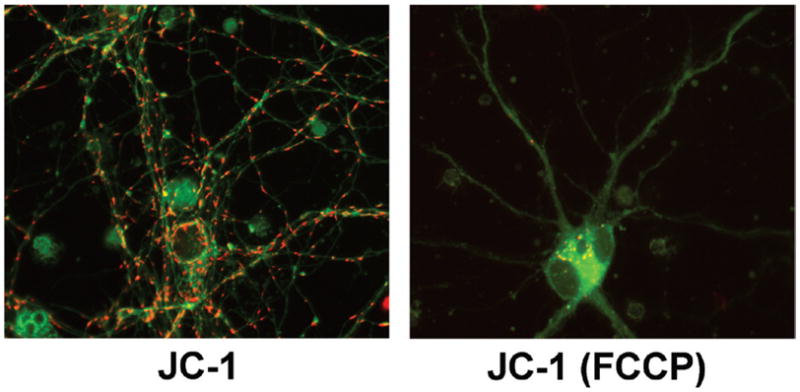
Figure 3. JC-1 in neuronal mitochondria.

11–14-day-old primary mouse cortical neurons were loaded for 45 min at 37°C with 1 μg/mL (1.5 μM) JC-1 in Hanks Balanced Salt Solution (HBSS), either without (JC-1) or with [JC-1 (FCCP)] 10 μM FCCP in the loading bath. After the 45 min loading, cells remained in the same loading bath, and for each field sequential green (JC-1 monomers) and red (JC-1 aggregates) images at 60× were taken for each condition (100-ms exposure times) using HQ480/40x:Q505LP:HQ535/50m (green) and HQ560/55x:Q595LP:HQ645/75m (red) filters and dichroic sets; one green/red overlay image/condition is presented here. Images are the raw 12-bit images, converted to 8-bit for presentation using ImageJ. When combining green/red images, some adjustments to image stretch and tone were made to each green or red image, for overlay display contrast purposes only, to ensure that all red JC-1 aggregates in both conditions are visible. Note that even after 45 min loading at 1 μg/mL (1.5 μM) (Invitrogen product data sheet suggests 1 μg/mL for 30 min for neurons), in neuronal soma but not neurites, there appear to be concentrated JC-1 monomers (green) in polarized mitochondria (since completely depolarized mitochondria will not accumulate significant cationic JC-1. In the neuronal cell body at lower middle of the left-hand image, note the green fibrillar mitochondria labeling, similar in appearance to the TMRE staining in polarized mitochondria in Figure 1). While it is possible this reflects small “real” differences in Δψm between these cellular regions, it also possible that due to different S/V ratios in neurites versus soma and the slow permeance of JC-1, dye concentrations in soma mitochondria have not yet reached aggregation threshold (i.e., they have not yet become red), whereas aggregation threshold is reached sooner in neurites. This example highlights some of the complexities of using JC-1 that must be kept in mind. In the depolarized (FCCP) condition, specific mitochondrial JC-1 labeling appears nearly absent as reflected by a near complete loss of both mitochondrially concentrated monomers (green) and aggregates (red). The little bit of aggregate labeling that does exist in the FCCP condition may reflect a few remaining polarized mitochondria, or more likely, nonspecific vesicular labeling similar to that seen with FCCP+TMRE in Figure 1. Though not seen well here due to contrast adjustments, considerably higher background fluorescence again occurred in the FCCP condition, from JC-1 not concentrated by mitochondria.
