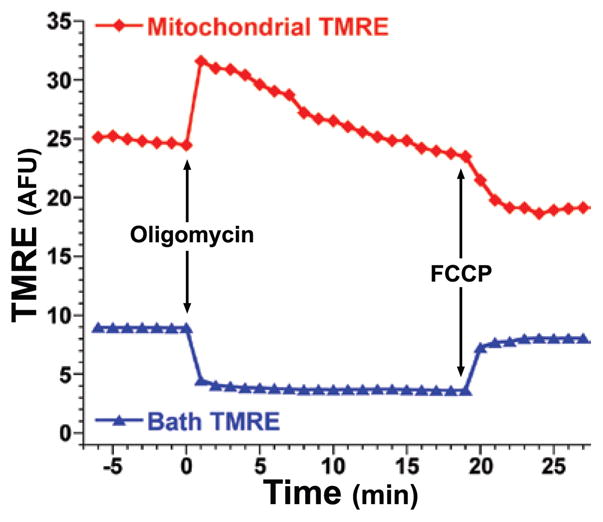
Figure 4. Acute tracking of nonquenching mitochondrial TMRE.

11–14-day-old primary mouse cortical neurons were loaded for >20 min at 37°C with 1 nM TMRE in HBSS. After the loading period, cells remained in the same loading bath, and using a Chroma HQ535/50x:Q565LP:HQ610/75m filter and dichroic set, CCD images were captured (1 image/min for 7 min) to establish a baseline; this was followed by direct addition of oligomycin (5 μg/mL) or FCCP (10 μM) at the times indicated by the arrows, which respectively caused the characteristic increase (hyperpolarization of Δψm) and decrease (depolarization of Δψm) of Fm as expected (red trace). These changes, as expected, were mirrored by an opposing decrease and increase in bath (background) TMRE signal (Fec) (blue trace) as mitochondria absorbed or released TMRE in response to hyperpolarization and depolarization respectively. Monitoring Fm (or Fwc) and Fec in parallel represents a simple and convenient approach to help verify expected redistribution behavior of these probes.
