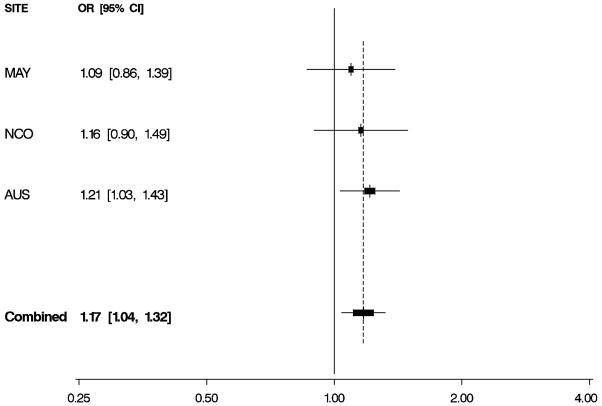
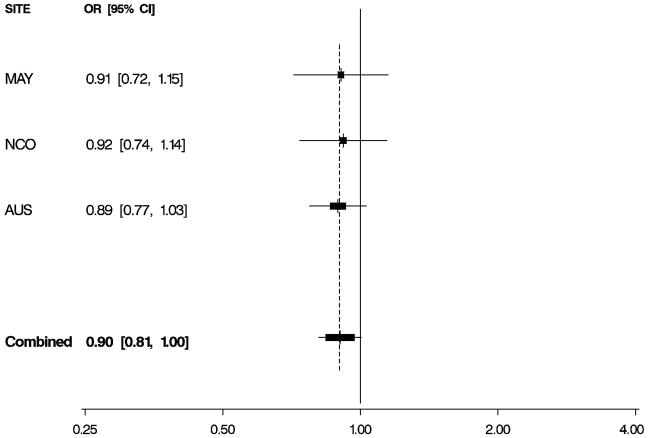
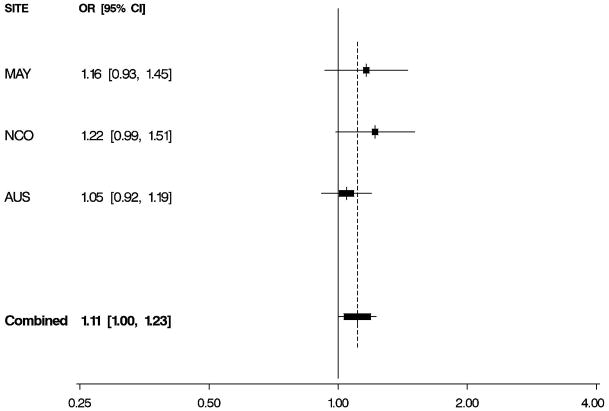
Figure 1. Odds Ratios by Study and Combined.
Per-allele odds ratios (ORs) and 95% confidence intervals (CIs) by study and combined, adjusted for age and study site. Boxes indicate ORs and are proportionally sized relative to the number of particpants; horizontal bars represent 95% CIs. A vertical dashed line indicates the combined OR estimate. A. EPHX1 rs1051740 and risk of invasive serous ovarian cancer. B. ADH4 rs1042364 and risk of invasive ovarian cancer. C. NQO1 rs2917666 and risk of invasive ovarian cancer.


