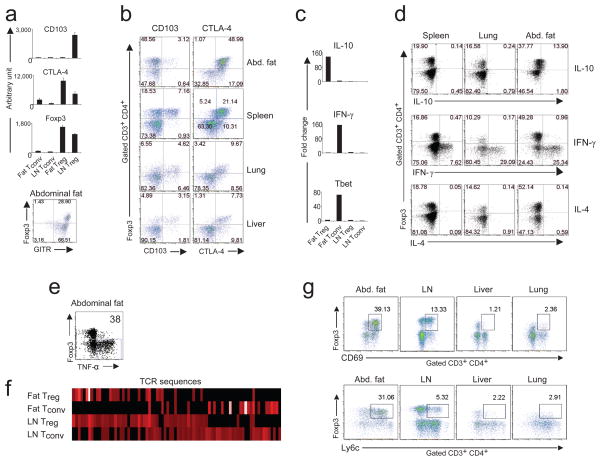
Figure 3.
Phenotypic characterization of Treg cells from abdominal (epidydimal) fat tissue, spleen, lung and liver. (a and b) Cells were isolated from retired-breeder B6 mice, and the SVF fraction was stained for Foxp3, CD3, CD4, CD8, CD25, GITR, CD103 and CTLA-4. (a and c) Relative RNA expression of selected genes from Treg and Tconv cells from LN and fat. (d and e) Cytokine-expression profile from Treg and Tconv cells from spleen, lung and fat tissue. Profiles for IL-10, IFN-γ and IL-4. Representative dot plots of at least three independent experiments are shown. Organs from 4–6 mice were pooled per experiment. (f) TCR sequences of fat-derived Treg and Tconv cells. Abdominal fat and LN Treg and Tconv cells were isolated from old male animals from the Limited (LTD) mouse line. The frequency of the CDR3α sequences was analyzed on a single-cell base. Graphic display of the TCR sequences in a heat-map format from Treg and Tconv cells. (g) Cells were isolated from abdominal adipose tissue, LN, liver and lung from retired-breeder B6 mice, and the SVF fraction was stained for Foxp3, CD3, CD4, CD8, and for the activation marker CD69 and Ly6c. Representative dot plots are shown.

