Figure 6.
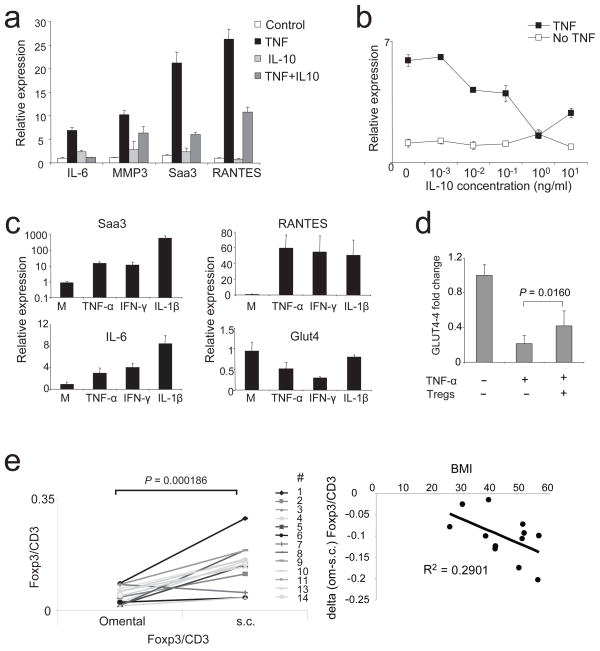
Cytokine effects on adipocytes and human correlates. (a and b) IL-10 can reverse TNF-α mediated inflammatory changes in differentiated adipocytes. (a) Expression of IL-6, MMP3, SAA3 and RANTES were measured with qPCR under unmanipulated culture conditions (control); adipocytes were treated with TNF-α (TNF); cells were treated IL-10 (IL-10) alone; or cells were treated with TNF-α and IL-10 (TNF+IL-10). (b) Relative expression of IL-6 in differentiated adipocytes, dose response curve of IL-10. TNF: TNF-α and different concentrations of IL-10. No TNF: only IL-10. Representative experiments are shown. (c) Expression of SAA3, RANTES, IL-6 and Glut4 in differentiated adipocytes, unmanipulated (M) or treated with TNF-α, IFN-γ and IL-1β. Representative experiments are shown. (d) Expression of Glut4 in differentiated adipocytes either unmanipulated or treated with TNF-α in presence or absence of spleen Treg cells. Mean and SD of 3 independent experiments are shown. P-value was calculated with T-test. (e) Paired human omental and s.c. adipose samples from mostly obese individuals (BMI range: 25.5–56.43, average: 44.85). Expression of FOXP3 and CD3 was measured by quantitative PCR. Plotted are the ratios of FOXP3 vs. CD3 for omental and s.c. adipose tissue (left panel). Right panel: the decrease in FOXP3/CD3 ratio in omental versus s.c. adipose tissue was plotted against the BMI for each individual donor from the left panel. Except the positive value of subject #7 (> 2 standard deviations from the mean) was not included. Each dot represents an individual donor.

