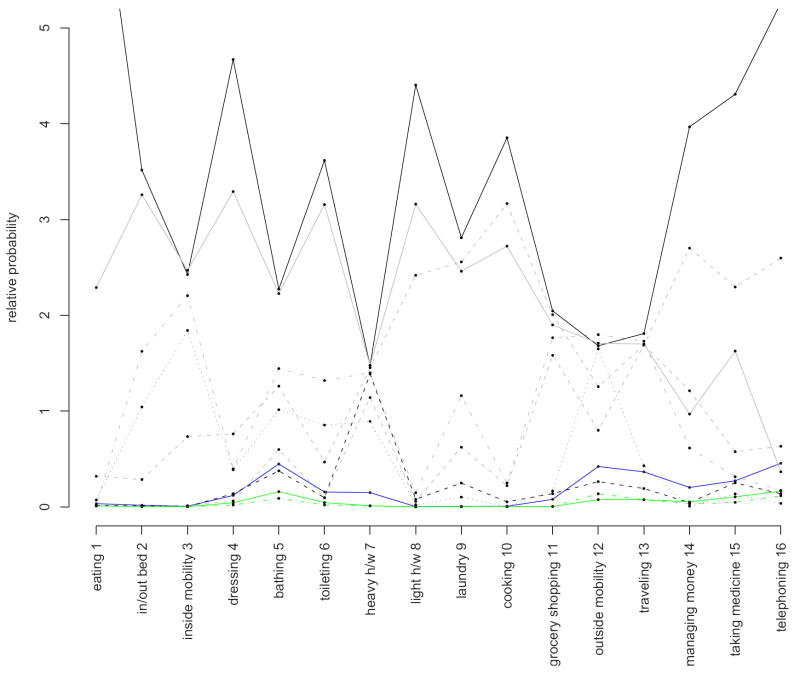
Table 9.
Functional disabilities average frequencies and relative frequencies by profile for the K = 8 GoM mixture model and for two healthy profiles from the basic K = 9 GoM model (green labels). Relative frequencies greater than 1 are in red.

| Activities | ||||||||||||||||
|---|---|---|---|---|---|---|---|---|---|---|---|---|---|---|---|---|
| profile 1 | 0.03 | 0.02 | 0.01 | 0.12 | 0.45 | 0.16 | 0.15 | 0.00 | 0.00 | 0.01 | 0.08 | 0.42 | 0.37 | 0.20 | 0.27 | 0.46 |
| profile 2 | 2.29 | 3.26 | 2.47 | 3.29 | 2.23 | 3.16 | 1.48 | 3.16 | 2.46 | 2.72 | 1.90 | 1.71 | 1.70 | 0.70 | 1.63 | 0.37 |
| profile 3 | 0.02 | 1.62 | 2.21 | 0.40 | 1.44 | 1.32 | 1.40 | 0.15 | 1.16 | 0.25 | 1.77 | 1.78 | 1.73 | 0.62 | 0.32 | 0.17 |
| profile 4 | 0.07 | 1.04 | 1.84 | 0.39 | 1.02 | 0.85 | 0.89 | 0.02 | 0.10 | 0.00 | 0.17 | 1.65 | 0.43 | 0.01 | 0.14 | 0.04 |
| profile 5 | 0.01 | 0.01 | 0.00 | 0.14 | 0.38 | 0.10 | 1.39 | 0.08 | 0.25 | 0.05 | 0.14 | 0.26 | 0.19 | 0.04 | 0.25 | 0.14 |
| profile 6 | 6.98 | 3.52 | 2.43 | 4.67 | 2.27 | 3.62 | 1.48 | 4.41 | 2.81 | 3.85 | 2.05 | 1.68 | 1.81 | 3.97 | 4.31 | 5.26 |
| profile 7 | 0.32 | 0.29 | 0.73 | 0.76 | 1.26 | 0.47 | 1.45 | 2.42 | 2.56 | 3.17 | 2.01 | 1.26 | 1.69 | 2.70 | 2.30 | 2.60 |
| profile 8 | 0.02 | 0.00 | 0.01 | 0.06 | 0.60 | 0.10 | 1.14 | 0.06 | 0.62 | 0.22 | 1.58 | 0.80 | 1.69 | 1.21 | 0.58 | 0.63 |
| profile 1* | 0.01 | 0.00 | 0.00 | 0.04 | 0.16 | 0.04 | 0.01 | 0.00 | 0.00 | 0.00 | 0.00 | 0.08 | 0.07 | 0.05 | 0.1 | 0.16 |
| profile 8* | 0.01 | 0.00 | 0.00 | 0.02 | 0.09 | 0.02 | 0.01 | 0.00 | 0.00 | 0.00 | 0.00 | 0.14 | 0.07 | 0.03 | 0.05 | 0.12 |
|
| ||||||||||||||||
| average frequency | 0.11 | 0.28 | 0.40 | 0.21 | 0.44 | 0.25 | 0.68 | 0.22 | 0.35 | 0.26 | 0.49 | 0.56 | 0.49 | 0.23 | 0.21 | 0.15 |
