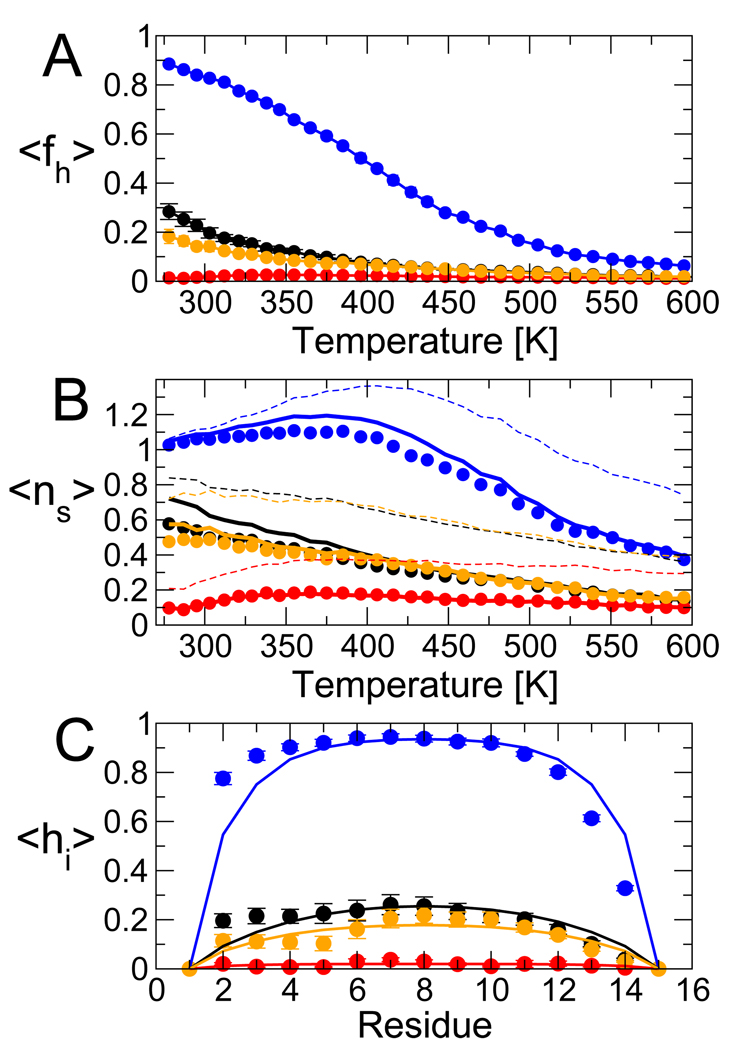
Figure 6.
Quality of LR fit to simulations of Ac-(AAQAA)3-NH2. (A) The average fraction helix 〈fh〉, with simulation data as symbols and model predictions as solid lines (blue: ff03, red: ff99SB, black: ff03*, orange: ff99SB*). (B) The average number of “helical segments”, 〈ns〉, with simulation data as symbols and model predictions as solid lines; broken lines give the prediction using the approximate expression 〈ns〉 ≈ Σi∂lnZ/∂lnv12i. (C) Fraction of helix for each residue in the 303 K replica, symbols and lines as above.

