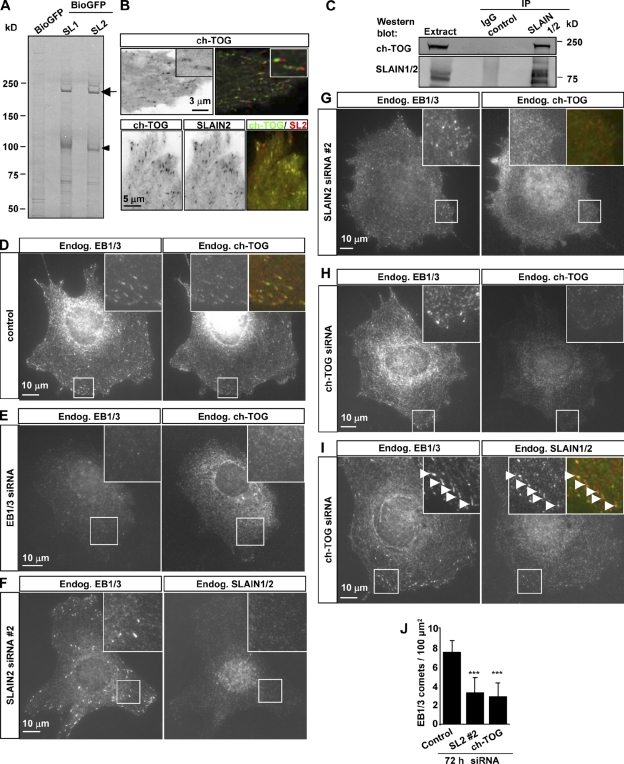
Figure 3.
SLAIN2 interacts with ch-TOG and promotes its MT plus end accumulation. (A) Streptavidin pull-down assay from HeLa cells expressing BioGFP or BioGFP-SLAIN1 (SL1) or -SLAIN2 (SL2) together with BirA. Proteins were analyzed by Coomassie staining. The arrow indicates ch-TOG, and the arrowhead indicates BioGFP-SLAIN1/2. (B) Live imaging of HeLa cells transiently expressing GFP–ch-TOG alone (top) or in combination with mCherry-SLAIN2 (bottom) collected as described for Fig. 1 D. The top right image shows maximum intensity projection of two consecutive averaged frames displayed in green and red. Insets show enlarged views of individual MT plus ends. (C) IPs from HeLa cell extracts with either the IgG control or SLAIN1/2 antibody were analyzed by Western blotting with the indicated antibodies. (D–I) 3T3 cells were transiently transfected with different siRNAs, fixed, and stained with the indicated antibodies. The insets show enlargements of the boxed areas. Arrowheads in I indicate MT plus ends. In the overlay in D, G, and I, EB1/3 is in red, and ch-TOG or SLAIN1/2 is in green. (J) Quantification of the number of EB1/3-positive comets per 100-µm2 surface area in control 3T3 cells or cells depleted of SLAIN2 or ch-TOG (11–14 cells were analyzed for each condition). Error bars show SD. Values significantly different from control are indicated with asterisks; ***, P < 0.001. Endog., endogenous.

