Figure 3.
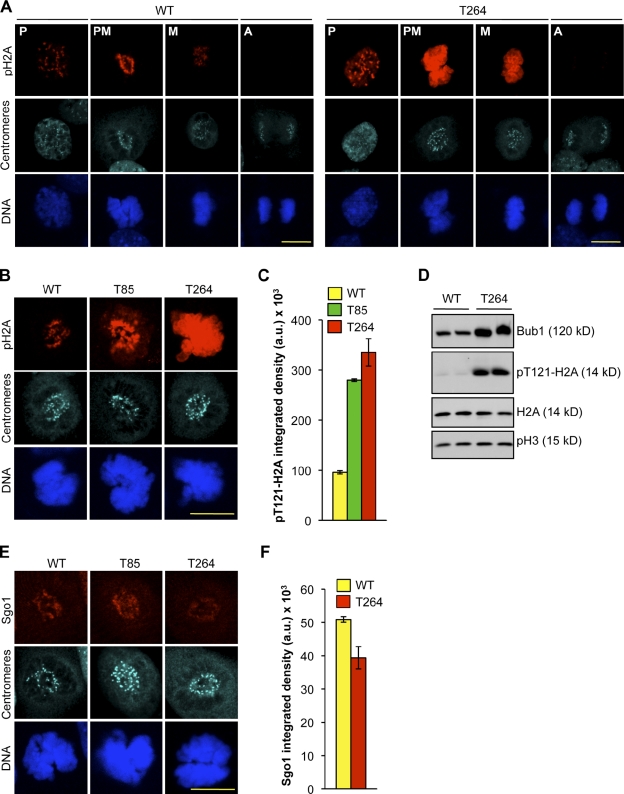
Bub1 overexpression results in aberrant Bub1 substrate phosphorylation. (A) Representative images of wild-type and Bub1T264 MEFs at the indicated stages of mitosis that were immunostained for pT121-H2A and centromeres. DNA was visualized with Hoechst. Bar, 10 µm. (B) Representative images of wild-type, Bub1T85, and Bub1T264 prometaphases that were immunostained for pT121-H2A and centromeres. DNA was visualized with Hoechst. Bar, 10 µm. (C) Quantification of pT121-H2A signal of images from B. Data shown are the average of three independent lines and error bars represent SEM. (D) Protein extracts from cycling MEFs of the indicated genotype were blotted and probed for Bub1, pT121-H2A, H2A, and pS10-H3. (E) Representative images of wild-type, Bub1T85, and Bub1T264 prometaphases that were immunostained for centromeres and Sgo1. DNA was visualized with Hoechst. Bar, 10 µm. (F) Quantification of Sgo1 signal of images from E. Data are the average of three independent lines and error bars represent SEM.

