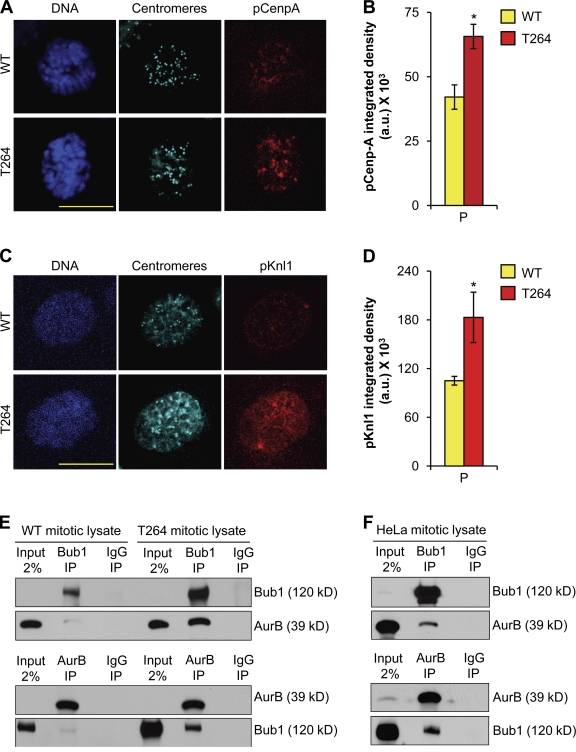
Figure 4.
Aurora B activity is increased in Bub1-overexpressing cells. (A) Representative images of wild-type and Bub1T264 prophase cells immunostained for pCenp-A and centromeres. DNA was visualized with Hoechst. Bar, 10 µm. (B) Quantification of the pCenp-A signal using ImageJ software. Error bars represent SEM. *, P < 0.05 vs. wild type (unpaired t test). (C) Representative images of wild-type and Bub1T264 prophase cells immunostained for pKnl1 and centromeres. DNA was visualized with Hoechst. Bar, 10 µm. (D) Quantification of the pKnl1 signal using ImageJ software. Error bars represent SEM. *, P < 0.05 vs. wild type (unpaired t test). (E) Mitotic extracts of wild-type and Bub1T264 cells subjected to immunoprecipitation with Bub1, Aurora B, or IgG antibodies and analyzed by Western blotting as indicated. (F) Mitotic extracts prepared from taxol-treated HeLa cells subjected to immunoprecipitation with Bub1, Aurora B, or IgG antibodies and analyzed by Western blotting as noted.

