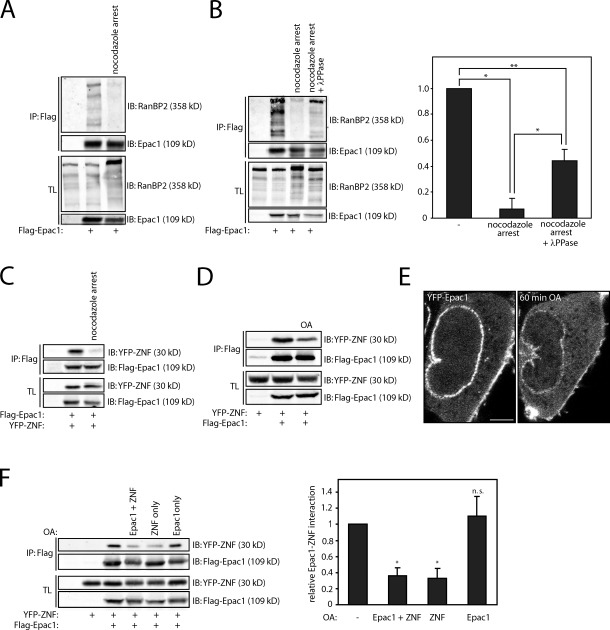
Figure 4.
Phosphorylation of the ZNFs of RanBP2 releases Epac1 from the NPC. (A) Coimmunoprecipitation of endogenous RanBP2 with Flag-tagged Epac1 in U2OS cells that were arrested in mitosis by 24-h incubation with 2.5 µM thymidine, washed three times with PBS, and incubated for 16 h with 250 ng/ml nocodazole. Mitotic cells were subsequently collected by mitotic shake off and subjected to coimmunoprecipitation. (B) Coimmunoprecipitation of endogenous RanBP2 with Flag-tagged Epac1 in U2OS cells that were arrested in mitosis similar to panel A but with treatment of the lysate with 1 µM λ-phosphatase for 30 min before immunoprecipitation of Flag-Epac1. The quantification shows the mean with standard deviation of the relative binding of RanBP2 to Flag-Epac1 from three independent experiments. Statistical analysis was performed using a one-tailed Student’s t test. Asterisks indicate the p-value of the respective sample with the associated control sample. *, P < 0.007; **, P < 0.0005. (C) Coimmunoprecipitation of the YFP-tagged individual ZNF (ZNF #2) of RanBP2 (YFP-ZNF) with Epac1 in U2OS cells that were arrested in mitosis similar to panel A. (D) Coimmunoprecipitation of the YFP-tagged individual ZNF (ZNF #2) of RanBP2 (YFP-ZNF) with Flag-tagged Epac1 in HEK293T cells after stimulation with the phosphatase inhibitor okadaic acid (OA; 1 µM) for 1 h. OA results in a decrease in electrophoretic mobility of both YFP-ZNF and Flag-Epac1 and a decrease in association of the two proteins. (E) Confocal live imaging of HEK293T cells transfected with YFP-Epac1 before and 1 h after stimulation with 1 µM OA. This shows the decreased presence of Epac1 at the nuclear envelope upon OA stimulation. Note that also the plasma membrane localization of Epac1 is affected by OA stimulation, whereas an increase in cytosolic YFP-Epac1 is observed. Bar, 2 µm. (F) Coimmunoprecipitation of YFP-ZNF with Flag-tagged Epac1 after selective induction of phosphorylation of either YFP-ZNF or Flag-Epac1 by OA. Two separate dishes of HEK293T cells were transfected with either YFP-ZNF or Flag-Epac1 where indicated, and either one of the two or both were stimulated with 1 µM OA. Subsequently, the cell lysates of YFP-ZNF– and Flag-Epac1–expressing cells were mixed and subjected to coimmunoprecipitation. This demonstrates that OA stimulation of YFP-ZNF–transfected cells, but not Flag-Epac1–transfected cells, inhibits the binding between the two proteins. The quantification shows the mean with standard deviation of the relative binding of YFP-ZNF to Flag-Epac1 from three independent experiments. Statistical analysis was performed using a one-tailed Student’s t test. *, P < 0.0001. The minus signs indicate unstimulated cells. IB, immunoblot; IP, immunoprecipitation; TL, total lysate.

