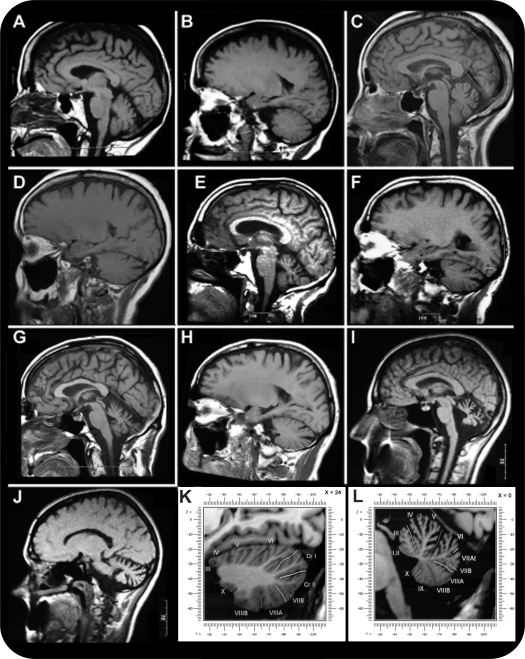
Figure 2. T1-weighted MRI illustrating the spectrum of cerebellar atrophy found in the cerebellar ataxia with neuropathy and bilateral vestibular areflexia syndrome (CANVAS).
(A) Sagittal view of very mild cerebellar atrophy; (B) parasagittal view of very mild cerebellar atrophy; (C) sagittal view of very mild cerebellar atrophy; (D) parasagittal view of very mild cerebellar atrophy; (E) sagittal view of mild cerebellar atrophy; (F) parasagittal view of mild cerebellar atrophy; (G) sagittal view of moderate cerebellar atrophy; (H) parasagittal view of moderate cerebellar atrophy; (I) sagittal view of non-CANVAS pattern cerebellar atrophy for comparison; (J) parasagittal view of non-CANVAS pattern cerebellar atrophy for comparison; (K) parasagittal view of the labeled cerebellar lobules, and crus I and II; (L) sagittal view of the labeled cerebellar lobules.

