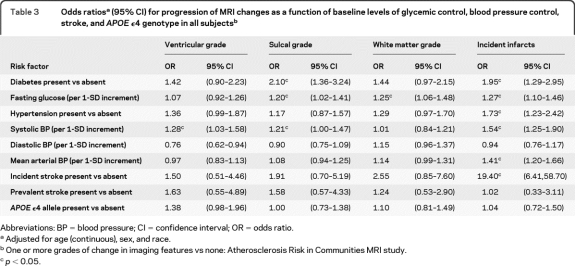
Table 3.
Odds ratiosa (95% CI) for progression of MRI changes as a function of baseline levels of glycemic control, blood pressure control, stroke, and APOE ϵ4 genotype in all subjectsb
Abbreviations: BP = blood pressure; CI = confidence interval; OR = odds ratio.
Adjusted for age (continuous), sex, and race.
One or more grades of change in imaging features vs none: Atherosclerosis Risk in Communities MRI study.
p < 0.05.

