
Figure 4. Role of the spasmodic mutation in determining mIPSC decay times.
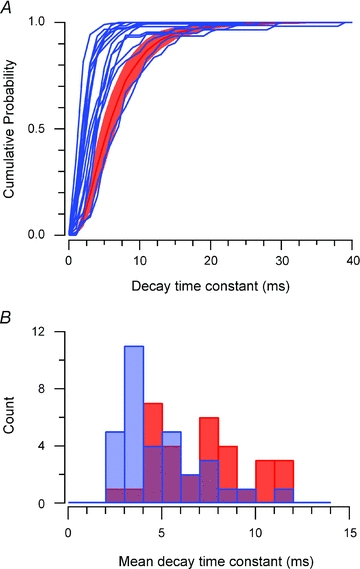
A, cumulative probability plots of glycinergic mIPSC decay time constant distributions for our sample of spasmodic neurones (blue lines; n = 16), overlain on the mean cumulative probability plot (with ±95% confidence intervals) for wild-type neurones (red; n = 17). Note, all but two spasmodic distributions fall outside the confidence intervals for wild-type mIPSCs. This indicates most glycinergic synapses are affected by the spasmodic mutation. B, histogram comparing ‘averaged’ glycinergic mIPSCs decay time constants in wild-type and spasmodic neurones. The distribution from wild-type neurones exhibits multiple peaks, whereas the spasmodic data are skewed to the left. This indicates most glycinergic mIPSCs in spasmodic neurones have fast decay times.