
Figure 5. Comparison of GABAAergic mIPSC properties in wild-type and spasmodic mice.
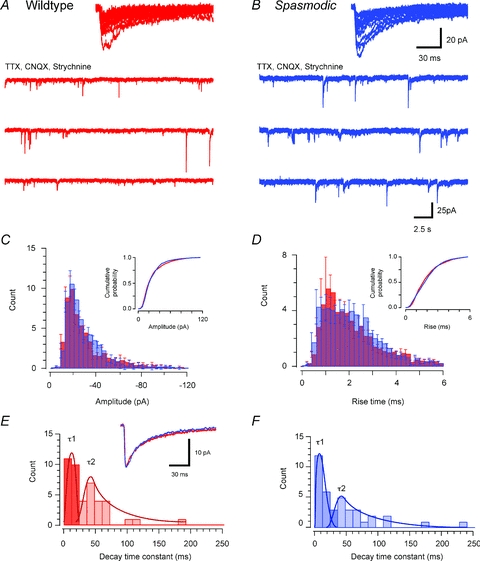
A and B, traces showing GABAAergic mIPSCs from wild-type and spasmodic SDH neurones in the presence of TTX (1 μm), CNQX (10 μm) and strychnine (1 μm). mIPSC frequency is similarly low in each genotype. Insets show overlain traces of captured mIPSCs in wild-type and spasmodic neurones. The amplitude and time course of these traces are similar for both genotypes. C and D, group data comparing mIPSC amplitude and rise time distributions (cumulative probability plots shown as insets). The amplitude and rise time of mIPSCs were similar for both genotypes. E and F, histograms comparing distributions for fast (dark bars) and slow (light bars) decay time constants fit to averaged mIPSCs from wild-type and spasmodic recordings. Inset shows averaged mIPSCs normalised to the same peak amplitude: note similar decay time courses. The fast and slow components of the decay phase were similar in both genotypes.