
Figure 3. Typical Fluo-4 records of activity at various stages of development.
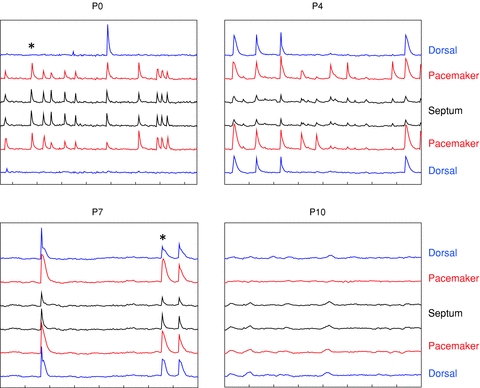
Traces are mean ΔF/F for the ROIs shown in Fig. 1. Traces are stacked so the regions on the left side of the slice are displayed in the upper half of each graph, those on the right side in the lower half. Moving upward or downward from the centre are septal nuclei (ROIs 1 in Fig. 1), the ventral pacemakers (ROIs 2), and the dorsal follower cortex (ROIs 3). Time markers on the x-axes are 20 s for all plots. Traces are stacked at intervals of 1%ΔF/F in all plots. Note the increasing fraction of waves that propagate into the dorsal cortex between P0 and P7. *Events shown in Fig. 4 films.