
Figure 6. NCX tail current analysis with two compartments to extract [Ca2+]nrs.
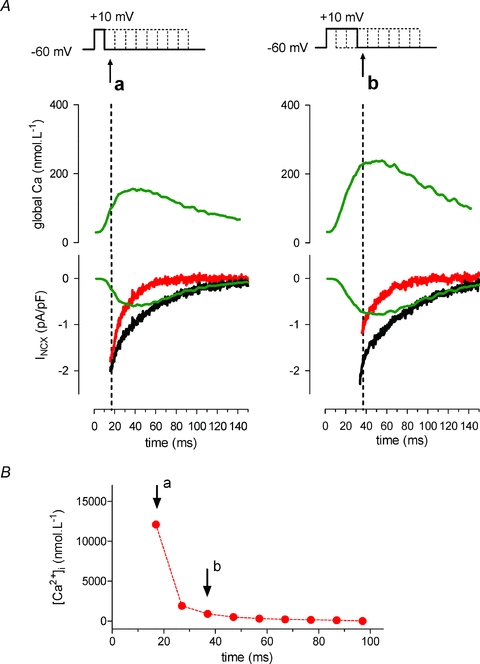
A, two recordings at 10 ms and at 30 ms into the depolarizing step are shown with the global [Ca2+]i transient and the recorded NCX tail current on repolarization (black current trace). Predicted values for NCX activated by the cytosolic Ca2+ transient are calculated using the NCX model equation of (Weber et al. 2001) (green trace). The difference current between the recorded (black trace) and calculated (green trace) then reflects NCX activated by Ca2+ near release sites and not reported by the cytosolic dye. This measurement is repeated every 10 ms. B, [Ca2+]nrs for during the example depolarizing step to +10 mV as calculated from the values of local NCX current at the corresponding time points.